FIGURE 3.

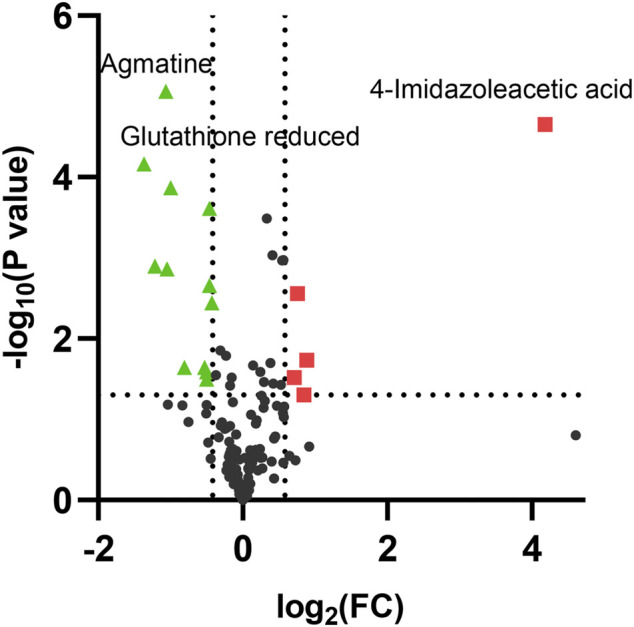
Volcano plot analysis of differential metabolites in A549 cells after exposure to 80 μM EGCG. The x-axis represents log2 (fold change), while the y-axis represents p-value in -log10 scale. The significantly up-regulated metabolites were indicated in red squares and down-regulated in green triangles. (p < 0.05 and fold change >1.5 or <0.75).
