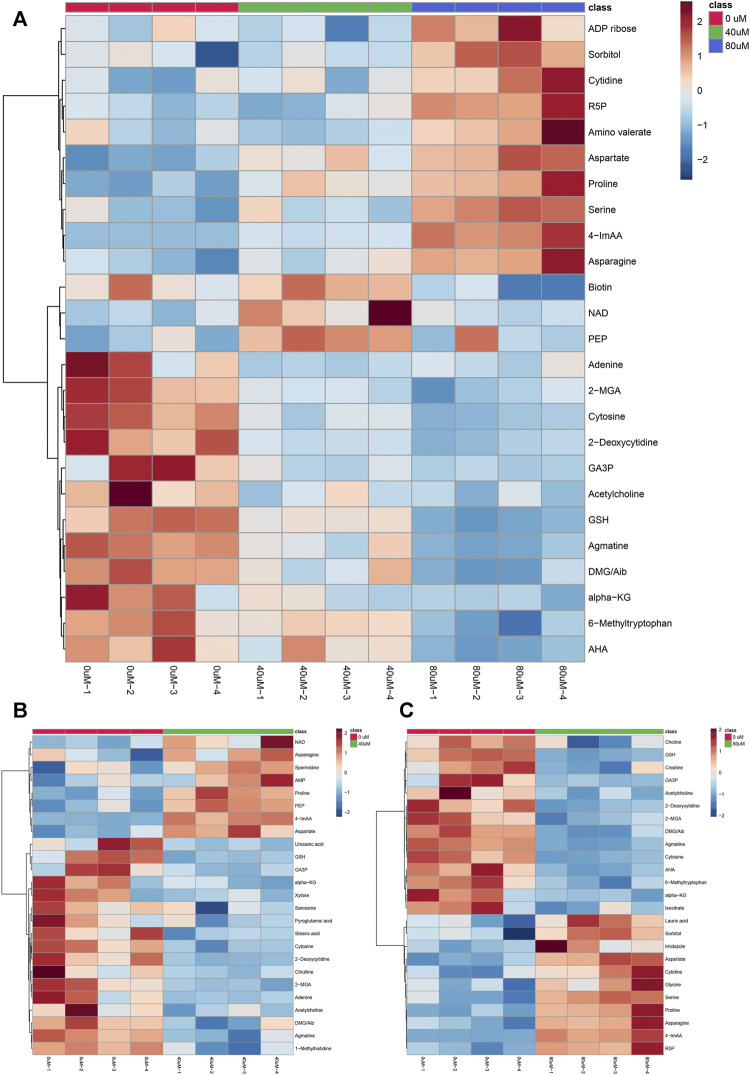
FIGURE 5.
Hierarchical clustering heat map of the top 25 differential metabolites selected based on t-tests/ANOVA, with the degree of change marked with red (up-regulation) and blue (down-regulation). The distance measure was set to “Euclidean” and the clustering algorithm was set to “Ward”. (A): control group, 40 μM EGCG-treated group and 80 μM EGCG-treated group; (B): control group and 40 μM EGCG-treated group; (C): control group and 80 μM EGCG-treated group. Abbreviations: R5P, Ribose-5-phosphate; 4-ImAA, 4-Imidazoleacetic acid; NAD, nicotinamide adenine dinucleotide; PEP, phosphoenolpyruvate; 2-MGA, 2-Methylglutaric Acid; GA3P, glyceraldehyde 3-phosphate; GSH, glutathione; DMG, Dimethylglycine; Aib, 2/3-Aminoisobutyric acid; alpha-KG, alpha-Ketoglutaric acid; AHA, Acetohydroxamic acid.

