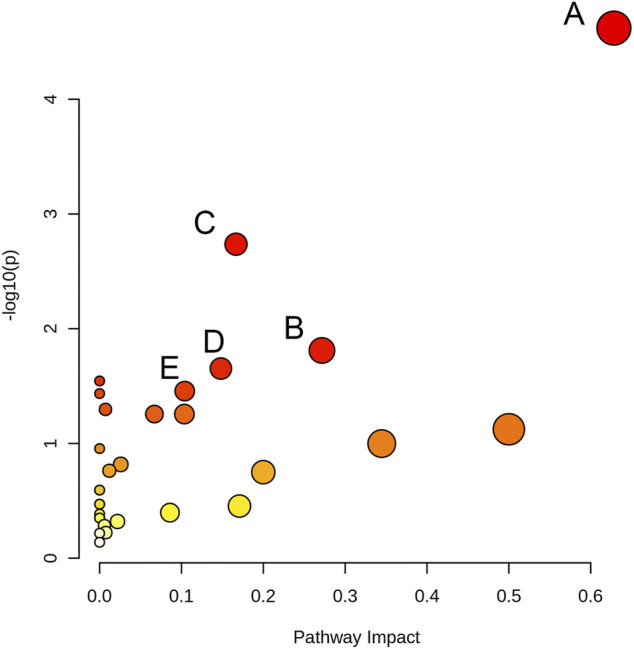
FIGURE 6.

Pathway analysis overview depicting altered metabolic pathways in A549 cells from control and 80 μM EGCG-treated groups. The metabolic pathways are displayed as distinctly colored circles depending on their enrichment analysis scores (vertical axis, shade of red) and topology (pathway impact, horizontal axis, circle diameter) via MetaboAnalyst 5.0. (A): Glycine, serine and threonine metabolism, (B): Alanine, aspartate and glutamate metabolism, (C): Aminoacyl-tRNA biosynthesis, (D): Glyoxylate and dicarboxylate metabolism E: Arginine and proline metabolism.
