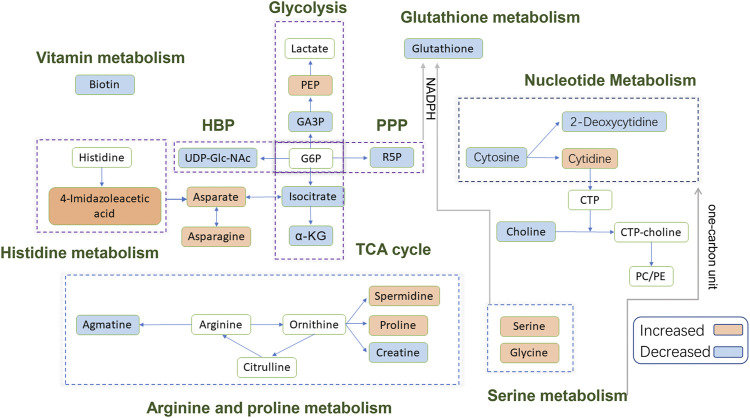
FIGURE 7.
Schematic diagram of the modulated metabolites and potential disturbed metabolic pathways. Up-regulated metabolites detected are shown in the orange background; down-regulated metabolites detected are shown in the blue background; blank background means no statistically significant change or undetected. Abbreviations: PEP, phosphoenolpyruvate; GA3P, glyceraldehyde 3-phosphate; G6P, glucose-6-phosphate; α-KG, alpha-Ketoglutaric acid; R5P, Ribose-5-phosphate; CTP, cytidine triphosphate; PC, phosphatidylcholine; PE, phosphatidylethanolamine; HBP, hexosamine biosynthetic pathway; PPP, pentose phosphate pathway; TCA, tricarboxylic acid.

