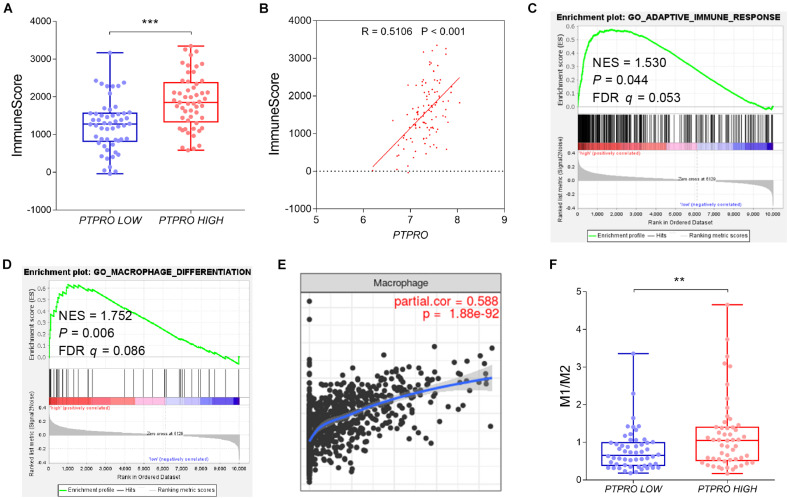
FIGURE 1.
PTPRO expression was associated with TAM infiltration in breast cancer. (A) Box and scatter plots showing the immune scores of PTPRO high expression group and PTPRO low expression group in the GEO dataset GSE36774. (B) Correlation between PTPRO expression and immune scores in the GEO dataset GSE36774. (C) GSEA showing the positive correlation between PTPRO expression and adaptive immune response signature in the GEO dataset GSE36774. (D) GSEA showing the positive correlation between PTPRO expression and macrophage differentiation-related gene signature in the GEO dataset GSE36774. (E) The correlation between PTPRO expression and the infiltration level of macrophages was presented by Tumor Immune Estimation Resource (TIMER; cistrome.shinyapps.io/timer). (F) Box and scatter plots showing M1/M2 ratio difference between PTPRO high expression group and PTPRO low expression group according to GEO dataset GSE36774. FDR q, false-discovery rate q-value; NES, normalized enrichment score; **P < 0.01, ***P < 0.001 by Student’s t-test.

