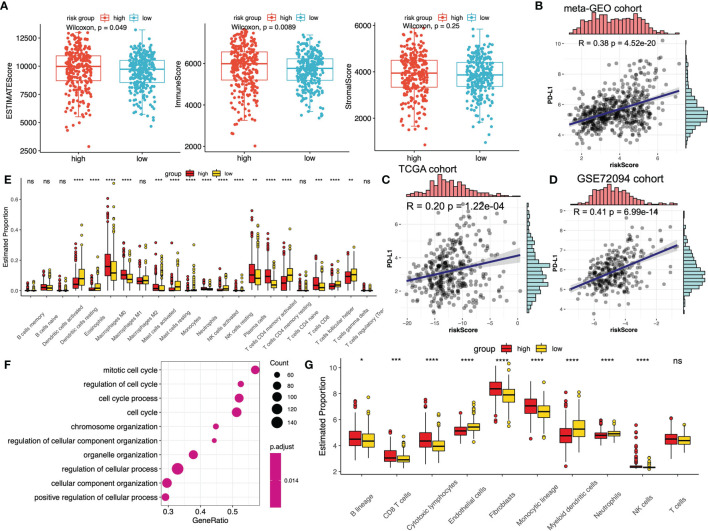
Figure 5.
The relationship between m6A-predictive score and immune infiltration. (A) Distribution of different immune scores (ESTIMATEScore, ImmuneScore and StromalScore) in low and high m6A-score groups. (B–D) The correlation analysis of PD-L1 expression levels and m6A-predictive score via Spearman correlation method in meta-GEO cohort, TCGA cohort and GSE72094 cohort. (E) The estimated fraction of different immune infiltrating cells calculated by CIBERSORT algorithm in different m6A-score groups (*P < 0.05; **P < 0.01; ***P < 0.001; ****P < 0.0001). (F) GSEA enrichment analysis (GO) of the top differentially expressed genes in the group with a high m6A-predictive score. (G) The estimated fraction of different immune infiltrating cells calculated by MCPcounter algorithm in different m6A-score groups. ns, not significant.

