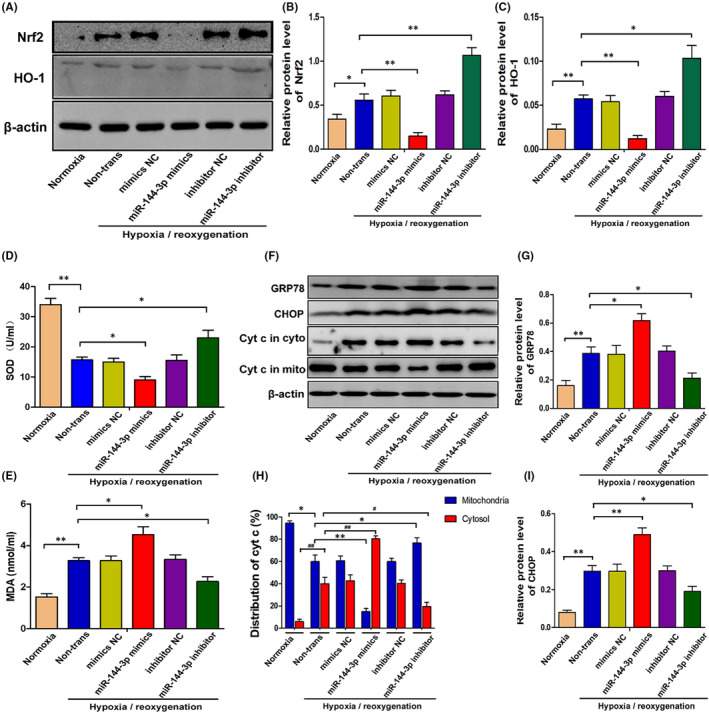
FIGURE 4.

MiR‐144‐3p regulates H/R‐induced Nrf2‐HO‐1 signaling pathway activation, oxidative stress, mitochondria and endoplasmic reticulum functions in vitro. A–C, The expression levels of Nrf2 and HO‐1 in TCMK cells transfected with miR‐144‐3p mimics or inhibitor after H/R treatment. Representative bands are shown in A, and the quantitative analysis of protein expression level is shown in B, C (n = 3). D, E, The SOD and MDA levels in cellular supernatant of TCMK cells transfected with miR‐144‐3p mimics or inhibitor after H/R treatment (n = 3). F–I, The expression levels of CHOP, GRP78 and Cytochrome C in TCMK cells transfected with miR‐144‐3p mimics or inhibitor after H/R treatment. Representative bands are shown in F, and the quantitative analysis of protein expression level is shown in G–I (n = 3). All data are expressed as the mean ± SD; data comparisons between multiple groups were performed using one‐way analysis of variance (ANOVA) with Tukey's post hoc test. *p < 0.05, **p < 0.01
