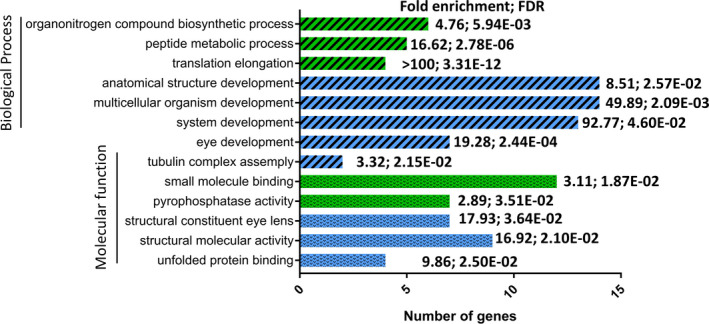
FIGURE 1.

Gene ontology (GO) functional annotation enrichment analysis of the upregulated (blue) and downregulated (green) proteins. GO term categories of biological processes are indicated by cross‐hatching and molecular function by dots. The number of genes in each category is indicated on the x‐axis. The fold enrichment and false discovery rate (FDR) are indicated for each category (Fisher's exact test)
