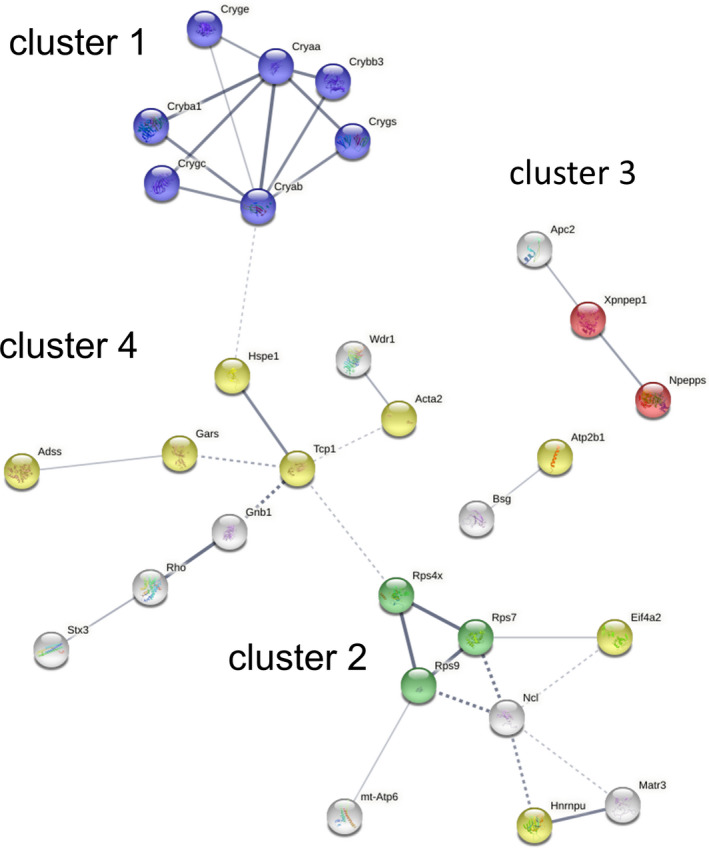
FIGURE 2.

Protein‐protein interaction network analysis. STRING analysis using high confidence level identified three enriched protein‐protein interaction networks in the 42 differentially expressed proteins. Connected functional and/or physical interacting proteins are represented by nodes, and the interaction between two proteins is represented by lines. The thickness of the lines indicates the strength of the data supporting the interaction; the dotted line indicates low edge confidence. Notable functional clusters are indicated and colour‐coded as follows: lens proteins/apoptotic process (cluster 1, blue), cytosolic small ribosome subunit (cluster 2, green), aminopeptidase activity (cluster 3, red) and purine ribonucleotide binding (cluster 4, yellow)
