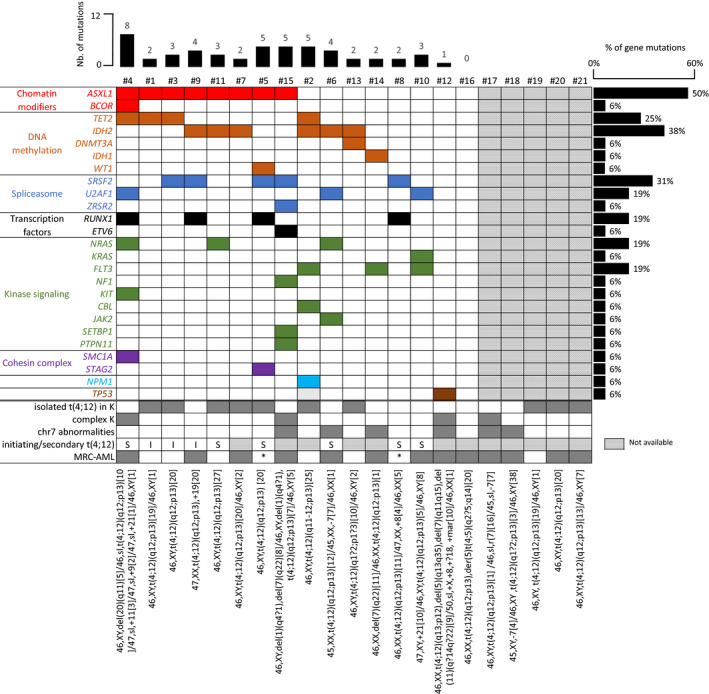
FIGURE 1.

Mutational and cytogenetic analyses of t(4;12) patients. Targeted sequencing data were available for 16 of 21 patients (complete list of targeted genes and mutations available in Tables S1 and S3). Each column represents a patient sample and each row a mutated gene. Mutated genes have been grouped by different functional categories. The percentage of each mutated gene in the whole cohort is indicated on the right of the grid, the number (nb) of mutations per sample on the top, and the complete karyotype by ISCN at the bottom. Coloured and dark grey box: presence; white box: absence; hatched boxes: not available. Abbreviations: I, initiating; S, secondary; K, karyotype, MRC‐AML, myelodysplastic‐related changes‐AML; NA, not available; *, not applicable (MDS with excess blasts)
