
FIGURE 1.
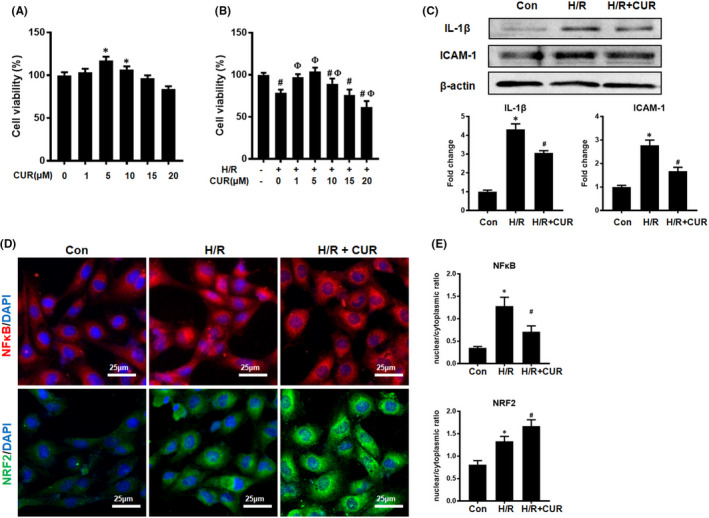
Effect of CUR on cell viability and cytokine production in HK2 cells under H/R conditions. (A and B) Cell viability was determined by CCK‐8 assay. *p < 0.05, vs. 0 μM CUR; # p < 0.05, vs. H/R – and CUR –; Фp < 0.05, vs. H/R + and 0 μM CUR. (C) Western blot analysis of IL‐1β and ICAM‐1 protein levels. (D) IF staining of NFκB and NRF2 in HK2 cells (scale bar = 25 μm). (E) Quantification of NFκB and NRF2 by IF staining. *p < 0.05, vs. the control group; # p < 0.05 vs. the H/R group (n = 3)