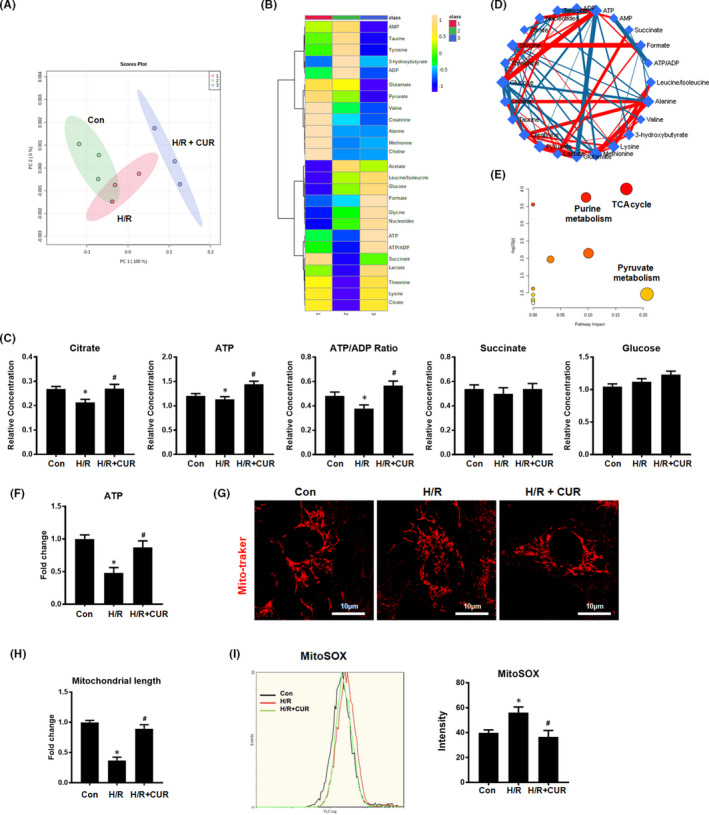
FIGURE 2.

Effect of CUR on mitochondrial metabolism in HK2 cells under H/R conditions. (A and B) PCA score plot and heat map showing different groups based on 1H NMR‐based metabolomic results. (C) Relative concentrations of citrate and ATP and the ATP/ADP ratio in HK2 cells. (D and E) Metabolic pathway analysis of differences in metabolite levels between the H/R and H/R + CUR groups. (F) Measurement of ATP levels in HK2 cells. (G and H) Representative micrographs showing MitoTracker staining of HK2 cells (scale bar = 10 µm) and quantification of mitochondrial length. (I) mtROS were measured by flow cytometry with MitoSOX staining. *p < 0.05 vs. the control group; # p < 0.05 vs. the H/R group (n = 3)
