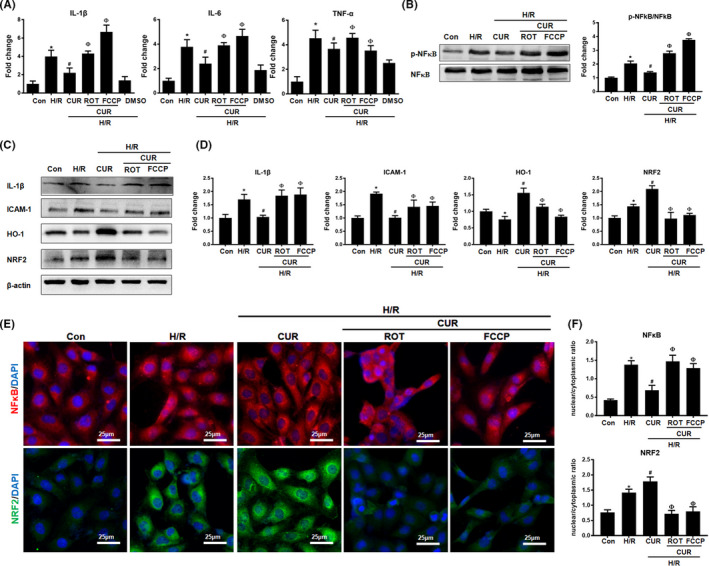
FIGURE 4.

Effect of pharmacological disruption of mitochondrial function on the anti‐inflammatory potential of CUR under H/R conditions. (A) Real‐time PCR analysis of IL‐1β, IL‐6 and TNF‐α mRNA levels in HK2 cells administered different treatments. (B) Western blot analysis and quantification of p‐NFκB levels in HK2 cells. (C‐D) Western blot analysis and quantification of IL‐1β, ICAM‐1, HO‐1 and NRF2 protein levels in hypoxic HK2 cells treated with CUR, CUR +ROT or CUR + FCCP. (E and F) IF staining of NFκB and NRF2 in HK2 cells under H/R conditions administered different treatments (scale bar = 25 μm). *p < 0.05 vs. the control group; # p < 0.05 vs. the H/R group; Ф p < 0.05 vs. the H/R + CUR group (n = 3)
