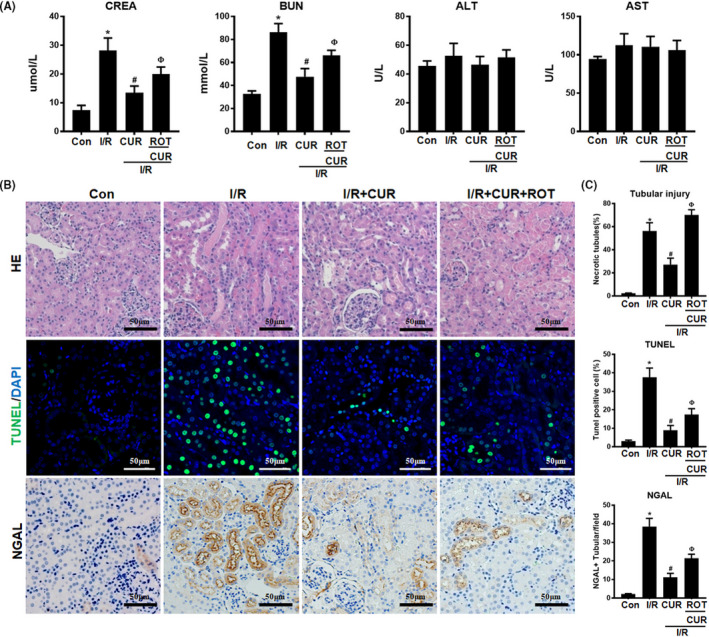
FIGURE 6.

Effect of mitochondrial disruption on the therapeutic potential of CUR in AKI mice. (A) Serum CREA, BUN, ALT and AST concentrations in mice of different groups on day 2 after I/R‐induced AKI. (B) Representative micrographs showing renal haematoxylin and eosin staining (scale bar = 50 µm), TUNEL staining (scale bar = 50 µm), and NGAL staining (scale bar = 50 µm) of the mouse kidneys on day 2 after I/R. (C) Quantitative analysis of necrotic tubules, TUNEL+ apoptotic cells and NGAL expression in the kidneys of mice in different groups. *p < 0.05 vs. the control group; # p < 0.05 vs. the I/R group; Ф p < 0.05 vs. the I/R + CUR group (n = 6)
