
FIGURE 7.
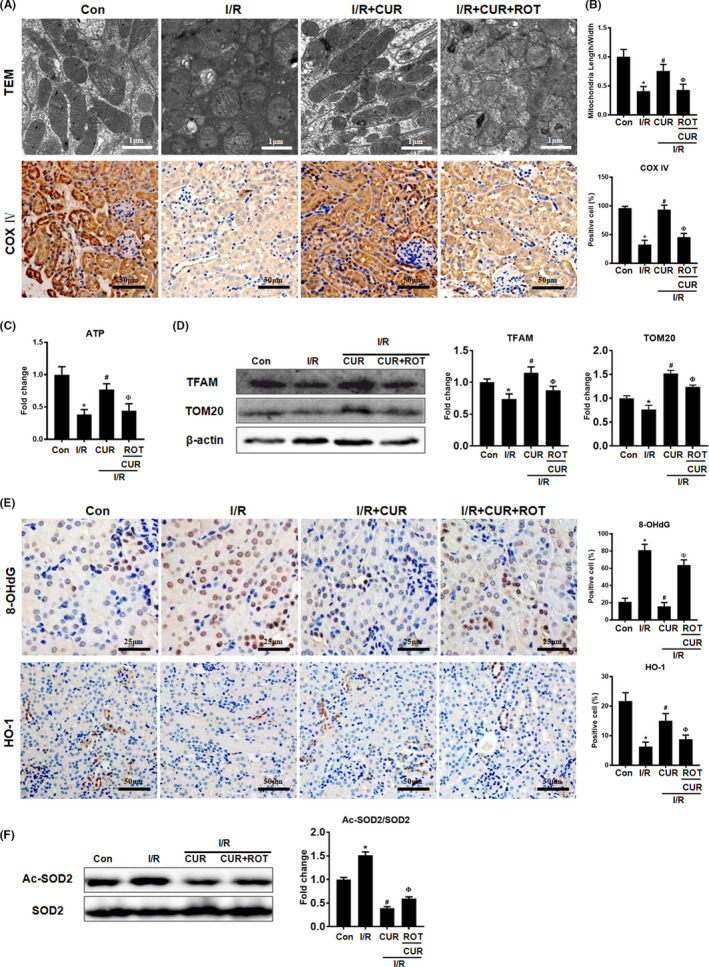
Effect of mitochondrial disruption on the antioxidant potential of CUR in AKI mice. (A) Representative TEM images of mitochondria in the renal tubules of mice (scale bar = 1 µm) and COX IV IHC staining (scale bar = 50 µm) on day 2 after I/R. (B) Quantitative analysis of the mitochondrial length to width ratio detected by TEM and COX IV protein expression. (C) Measurement of ATP levels in the kidneys of mice on day 2 after I/R. (D) Western blot analysis of the TFAM and TOM20 proteins in the kidney. (E) Representative micrographs showing 8‐OHdG IHC staining (scale bar = 25 µm) and HO‐1 IHC staining (scale bar = 50 µm) of the renal cortex and quantitative analysis of 8‐OHdG and HO‐1 levels. (F) Western blot analysis of the Ac‐SOD2/SOD protein ratio in kidneys of mice on day 2 after I/R and quantitative analysis of protein expression. *p < 0.05 vs. the control group; # p < 0.05 vs. the I/R group; Ф p < 0.05 vs. the I/R + CUR group (n = 6)