FIGURE 1.

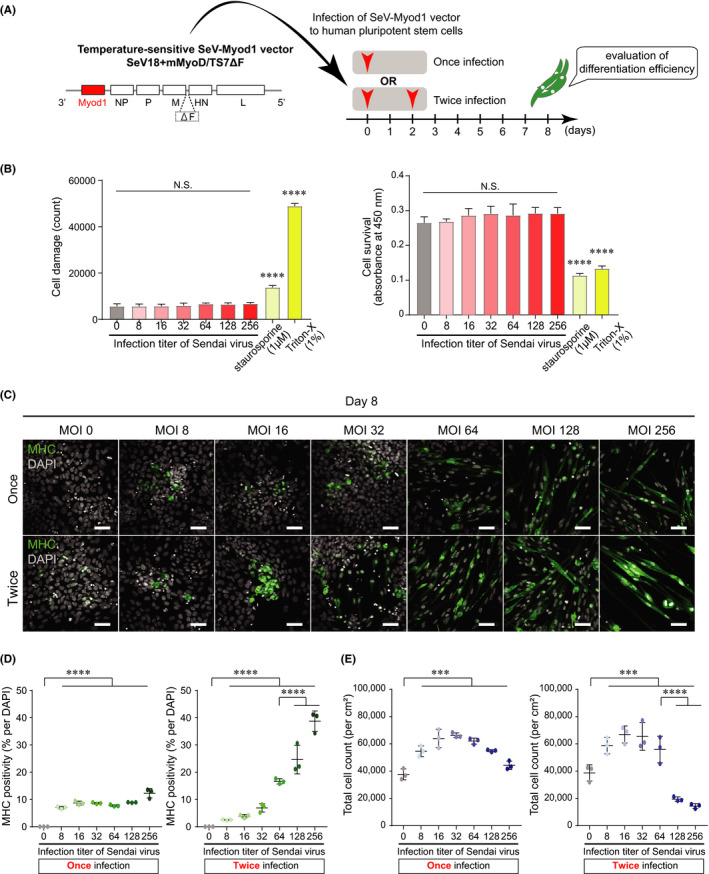
Infection of SeV‐Myod1vector converted human pluripotent stem cells into skeletal muscle cells. (A) Construction of SeV‐Myod1 vector and schema of experimental design. Differentiation efficiency was analysed on day 8 to optimize the SeV‐Myod1 concentration and evaluate the cellular toxicity. (B) Cell damage (left panel) and cell survival (right panel) were analysed at each described MOI condition or at the condition of adding staurosporine and Triton‐X as positive control for cell death. (Independent experiments n = 3, mean ± SD, ****p < 0.0001). (C) Immunofluorescence staining for myosin heavy chain (MHC, green) and DAPI staining (white) on day 8. Representative images are shown. Scale bar =100 μm. (D) MHC positivity (% against DAPI) was quantified from (C). Quantified positivity was shown in separate graphs for once infection (left panel) and twice infection (right panel) of SeV‐Myod1. (Independent experiments n = 3, mean ± SD, **** p < 0.0001) MHC: myosin heavy chain, (E) Total cell number was counted from (C). (Independent experiments n = 3, mean ± SD, ***p < 0.001, ****p < 0.0001)
