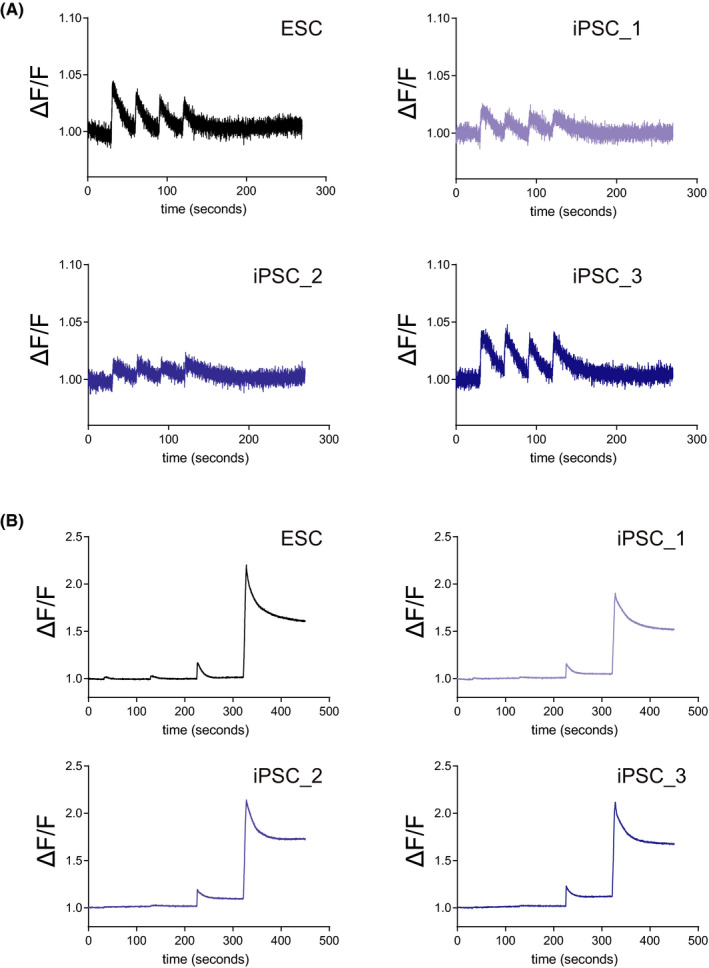
FIGURE 6.

SkM cells responded to electrical stimulations. (A) Differentiated SkM cells were cultured in a 96‐well plate. To evoke the Ca2+ response, SkM cells were subjected to 3 Hz electrical field stimulation (EFS) and were monitored by analysing the altered fluorescence, indicating the altered dynamics of cytosolic Ca2+ concentration, quantified as ΔF/F. (B) ΔF/F were monitored after EFS at 10 V/2 Hz, 10 V/10 Hz, 10 V/50 Hz and 20 V/50 Hz sequentially at 90‐second intervals
