FIGURE 2.

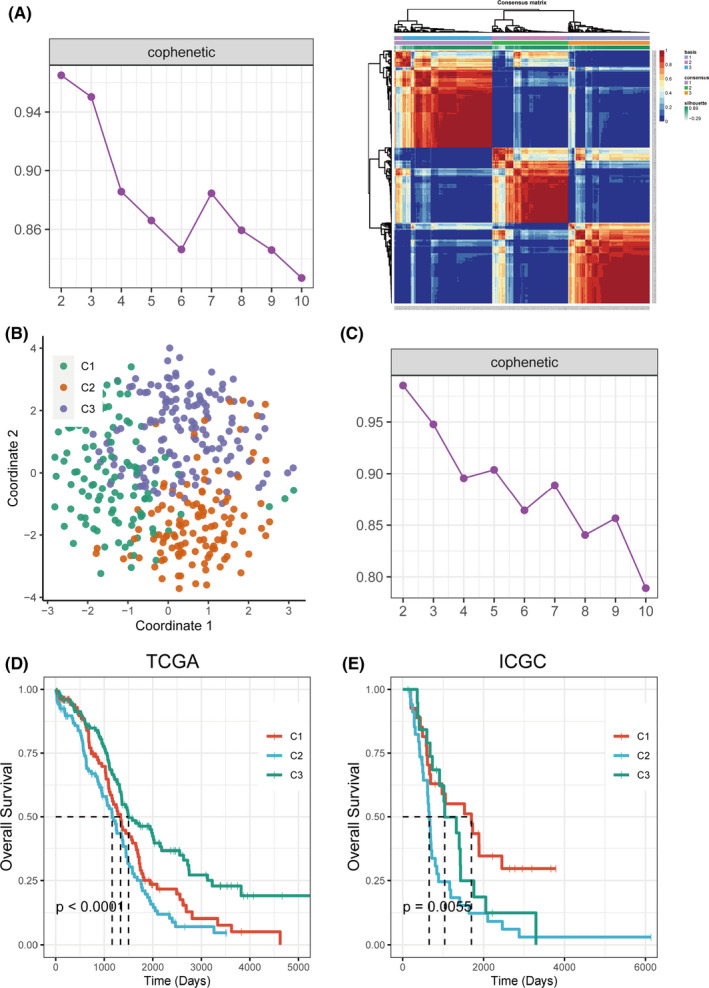
Identification of subtypes using NMF consensus clustering based on the metabolism‐associated genes. (A) NMF clustering using 109 metabolism‐associated genes in TCGA cohort. Cophenetic correlation coefficient for k = 2–10 was shown. The consensus matrix heatmap for k = 3 was shown. (B) t‐SNE analysis scatter plot based on 109 metabolism‐associated genes. (C) Cophenetic correlation coefficient of NMF clustering for k = 2–10 in ICGC cohort was shown. (D) KM curves showed prognostic relationship of three subtypes in TCGA and ICGC cohort, respectively; the p‐value was calculated using the log‐rank test, by comparing the overall survival of three subtypes
