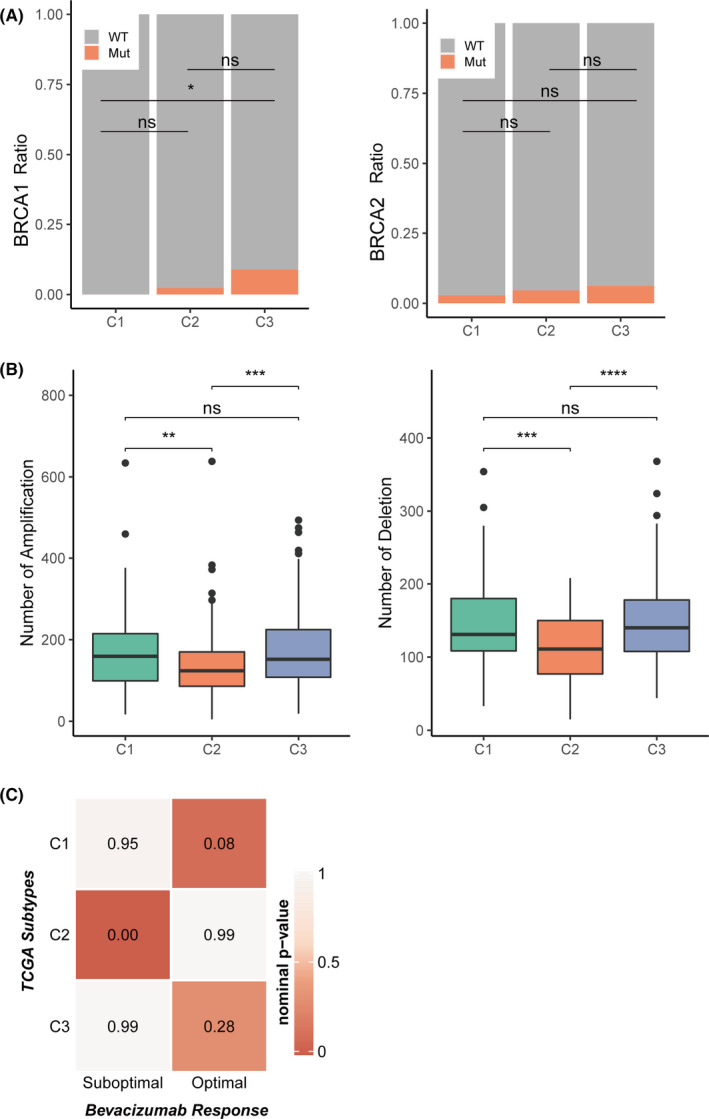
FIGURE 4.

The association between three subtypes and mutations, copy number aberrations and targeted drug response in TCGA‐OV cohort. (A) BRCA1 and BRCA2 mutation type/wild‐type ratio in three subtypes. (C) Boxplot of number of copy number aberrations. (D) Correlation between three subtypes and bevacizumab response. Between three subtypes. The statistical difference was compared by wilcox.test, and adjusted by ‘holm’ method (ns represents no significance, *p < 0.05, **p < 0.01, ***p < 0.001, ****p < 0.0001)
