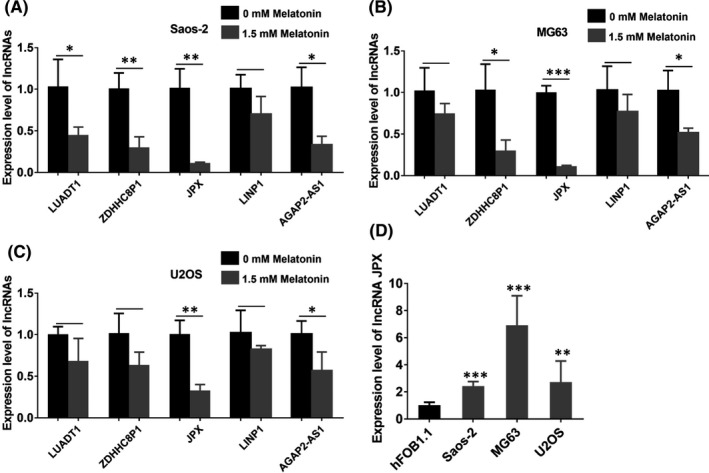
FIGURE 3.

Expression level of lncRNA JPX in OS cell lines. (A‐C) The expression level of lncRNA LUADT1, ZDHHC8P1, JPX, LINP1, AGAP2‐AS1 was measured by real‐time qPCR analysis in Saos‐2 (A), MG63 (B) and U2OS (C) cells after treatment with 1.5 mM melatonin. (D) Expression level of lncRNA JPX in OS cell lines (Saos‐2, MG63 and U2OS) and human osteoblasts. Significant difference relative to control group was presented as *p < 0.05; **p < 0.01 and ***p < 0.001
