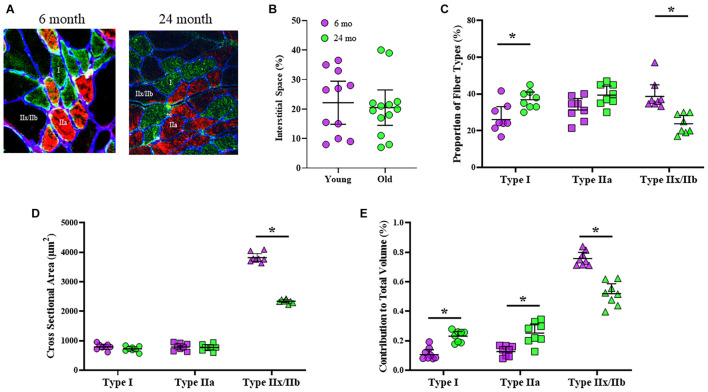
FIGURE 1.
(A) Representative, triple-labeled images of fiber typing based on immunoreactivity to primary antibodies for MyHCslow (red) and MyHC2A (green) isoforms with the inclusion of a primary antibody for laminin (blue) to clearly define the muscle fiber borders. (B) Scatterplot showing that the relative contribution of interstitial space to total DIAm cross-sectional area was unchanged between 6-month (purple) and 24-month (green) Fischer 344 rats (Student’s unpaired t-test, P > 0.05). (C) Scatterplot showing an increased proportion of type I fibers (circles) and a decreased proportion of type IIx/IIb fibers (triangles) in 24-month compared with 6-month rats (two-way ANOVA, *P < 0.05). (D) Scatterplot showing the mean fiber cross-sectional areas of type I (circles), type IIa (squares), and type IIx/IIb (triangles) fibers. Note the selective reduction in cross-sectional area of type IIx/IIb DIAm fibers in 24-month compared with 6-month rats (two-way ANOVA, *P < 0.05). (E) Scatterplot showing the relative contributions of each fiber type to total DIAm volume. Note the increased contribution of both type I and IIa DIAm fibers and the reduction in type IIx/IIb fibers to total DIAm volume in 24-month compared with 6-month rats (two-way ANOVA, *P < 0.05). All data sets include female and male rats per age group (see Table 2) with 15 fibers per type in each DIAm.

