FIGURE 2.
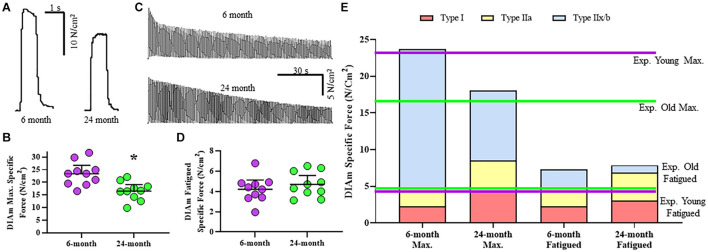
(A) Representative raw tracings of the maximum specific force generated at 75 Hz stimulation by the DIAm from a 6-month compared with a 24-month Fischer 344 rat (both male rats). (B) Scatterplot showing reduced DIAm maximum specific force in 24-month compared with 6-month rats (Student’s unpaired t-test, *P < 0.05). (C) Representative traces of the force decline (fatigue) of the DIAm during repeated stimulation at 40 Hz in 0.33 s duration trains repeated each second across a 2 min period from a 6-month compared with a 24-month rat. (D) Scatterplot showing unchanged DIAm specific force following 2 min of repeated activations in 24-month compared with 6-month rats (Student’s unpaired t-test, P > 0.05). (E) The maximum specific force contributed by type I (red boxes), type IIa (yellow boxes), and type IIx/IIb (blue boxes) DIAm fibers was modeled for 6-month compared with 24-month rats based on differences in fiber type contributions to total DIAm volume and previously reported differences in specific force generated by each fiber type (see Table 1). Experimental observations of DIAm specific force were superimposed in dashed lines for 6-month (dashed purple line) and 24-month (dashed green line) rats.

