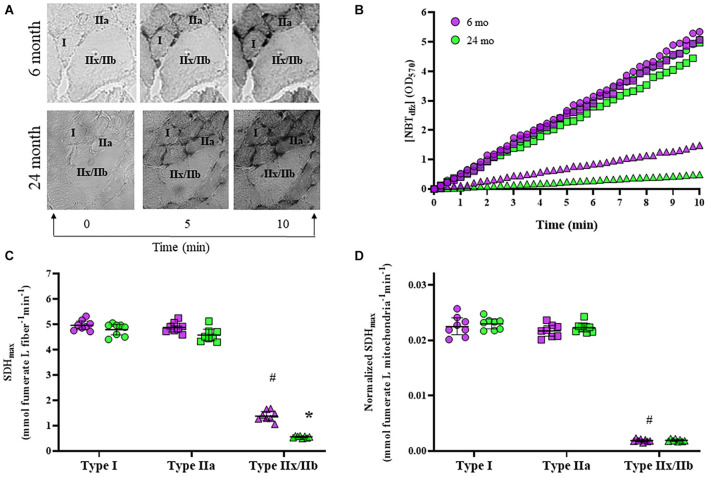
FIGURE 5.
(A) Representative images of the accumulation of NBTdfz (SDH reaction indicator) in DIAm fibers from 6- and 24-month Fischer 344 rats at 0, 5, and 10 min during the progression of the SDH reaction. (B) Measurements of mean fiber OD [indicating [NBTdfz] were obtained every 15 s during the SDH reaction for type I (circles), IIa (squares), and IIx/IIb (triangles) DIAm fibers from both 6-month (purple) and 24-month (green) male and female rats]. The SDH reaction was found to be highly linear (R2 = 0.99) during this period. From the slope of accumulation of [NBTdfz] (dOD/dt), the maximum velocity of the SDH reaction (SDHmax) was determined for each fiber. (C) SDHmax normalized to fiber volume was higher in type I and IIa DIAm fibers compared to type IIx/IIb fibers. SDHmax normalized to fiber volume was not different in type I and IIa DIAm fibers between 6-month and 24-month rats. SDHmax normalized to fiber volume in type IIx/IIb fibers was lower than that in type IIx/IIb DIAm fibers in 24-month compared with 6-month rats (two-way ANOVA, *P < 0.05). (D) SDHmax normalized to mitochondrial volume per fiber was higher in type I and IIa DIAm fibers compared to type IIx/IIb fibers. SDHmax normalized to mitochondrial volume per fiber was not different in type I and IIa DIAm fibers between 6-month and 24-month rats. SDHmax normalized to mitochondrial volume in type IIx/IIb DIAm fibers was lower in 24-month compared with 6-month rats (two-way ANOVA, *P < 0.05). # indicated difference between type IIx/IIb fibers and type I and IIa fibers of all ages.

