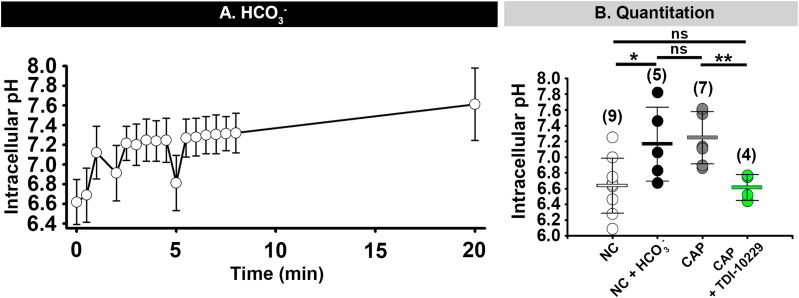
FIGURE 9.
HCO3–- induced increase of intracellular pH depends on sAC activity. (A) Mean and standard deviation values of intracellular pH in mouse epididymal sperm after addition of 15 mM HCO3– at 0 min) (n = 3 mice). (B) Graph showing sperm intracellular pH values after 60 min incubation in the indicated conditions. NC, non-capacitating; CAP, capacitating. Horizontal bars indicate mean and standard deviation. Mean values for intracellular pH were as follows: NC, 6.64 ± 0.349 (9 mice); NC + HCO3–, 7.17 ± 0.469 (5 mice); CAP, 7.25 ± 0.331 (7 mice); and CAP + TDI10229, 6.62 ± 0.164 (4 mice) respectively. Numbers in parentheses are numbers of animals. *P < 0.05 and **P < 0.01 by one-way ANOVA. ns, non-significant.

