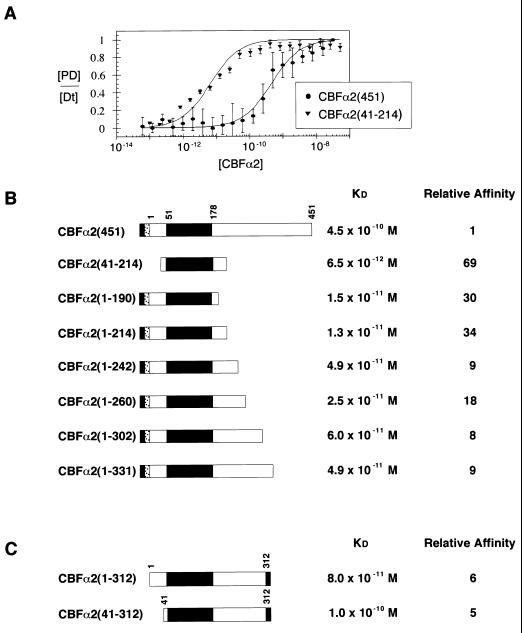
FIG. 2.
Modulation of CBFα2 DNA binding by C-terminal sequences. (A) Equilibrium DNA binding studies of full-length CBFα2(451) and CBFα2(41-214) were performed by EMSA and used to generate DNA binding curves. Data from at least three experiments provide mean and standard error for each data point. KD values were obtained by curve fitting as described in Materials and Methods. (B) Summary of equilibrium dissociation constants for truncated CBFα2. The black rectangle in the schematic diagram of CBFα2 represents the DNA-binding Runt domain. The gray and stippled boxes represent the H6 and FLAG tags, respectively. Relative affinity was calculated as the ratio of mutant affinity to the affinity of CBFα2(451). (C) Summary of equilibrium dissociation constants for CBFα2 proteins tagged at amino acid 312 with H6 (gray box).

