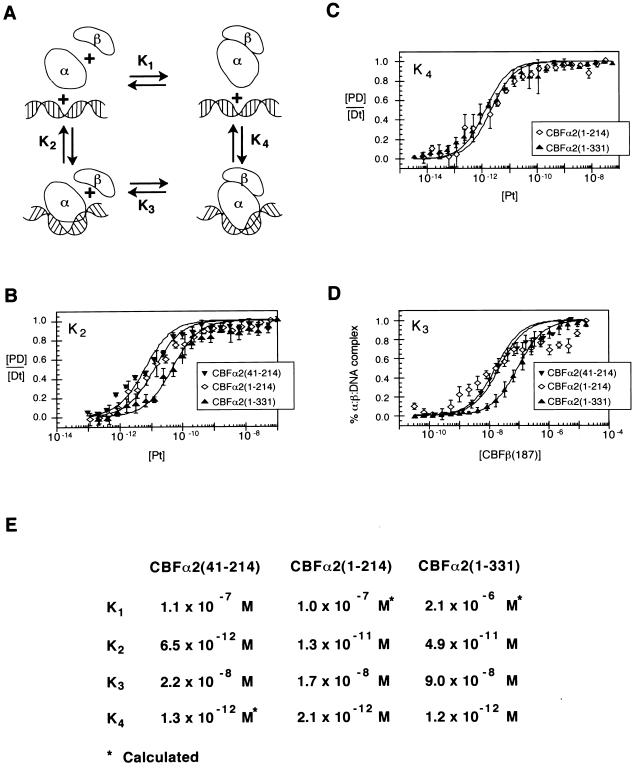
FIG. 3.
Thermodynamic box describing interactions between CBFα2, CBFβ, and DNA. (A) Schematic diagram of the potential interactions between CBFα2 (α), CBFβ (β), and DNA. The modeled bend in DNA induced by the Runt domain is suggested by both circular permutation analysis and circular dichroism spectroscopy (22; Crute et al., submitted). (B) Equilibrium dissociation constants (K2) of CBFα2(41-214), CBFα2(1-214), and CBFα2(1-331) for DNA. Data from at least three experiments are presented. Standard errors are 1.1 × 10⁻¹² M, 2.1 × 10⁻¹² M, and 7.1 × 10⁻¹² M, respectively. (C) Equilibrium dissociation constants (K4) of CBFα2-CBFβ heterodimers for DNA. Standard errors are 3.9 × 10⁻¹³ M for CBFα2(1-214) and 1.8 × 10⁻¹³ M for CBFα2(1-331). (D) Equilibrium dissociation constants (K3) of CBFβ for CBFα2-DNA complexes. Data represent at least three experiments. Standard errors are 3.2 × 10⁻⁹ M, 1.5 × 10⁻⁹ M, and 3.5 × 10⁻⁹ M for CBFα2(41-214), CBFα2(1-214), and CBFα2(1-331), respectively. (E) Summary of equilibrium dissociation constants K1, K2, K3, and K4. K4 for CBFα2(41-214) was not determined directly but calculated from K2K3 = K1K4. K1 for CBFα2(41-214) was determined independently (Crute et al., submitted).

