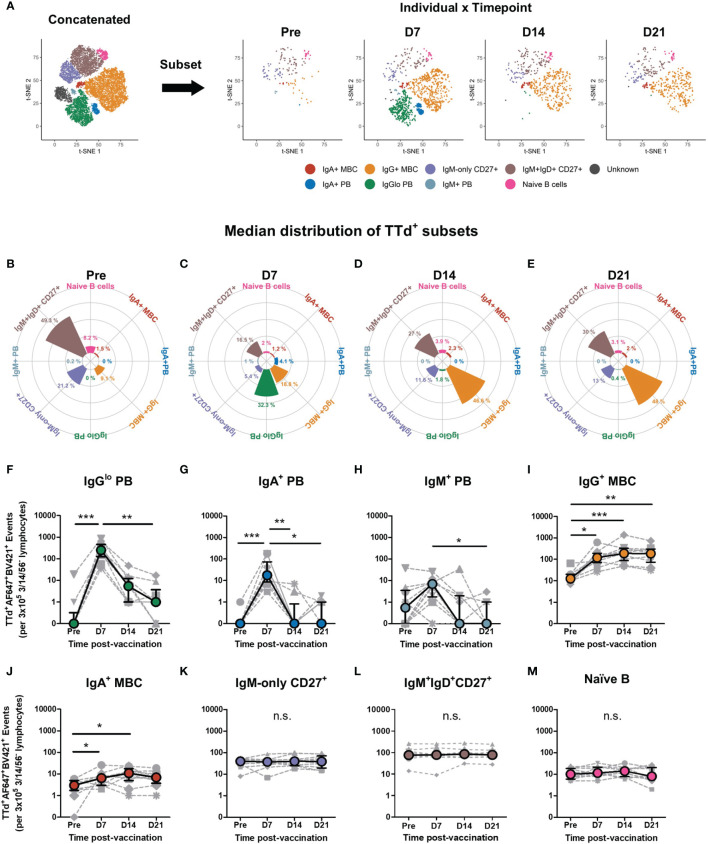
Figure 4.
Dynamic changes of TTd+ B cell subsets following booster ADT vaccination in healthy adults. (A) From the concatenated data representing all TTd+ events from 10 individuals at 4 timepoints, the concatenated t-SNE data set underwent data subsetting to examine TTd+ events for each individual at each time point (as shown in representative plots of an individual at days 7, 14 and 21 post-ADT). (B–E) t-SNE subset distribution (%median proportions) for each timepoint are shown as rose plots. (F–M) Median frequencies (events) of each t-SNE-defined subset are shown. (*, ** and *** denote p < 0.05, 0.005 and 0.0005, respectively). n.s., not significant.

