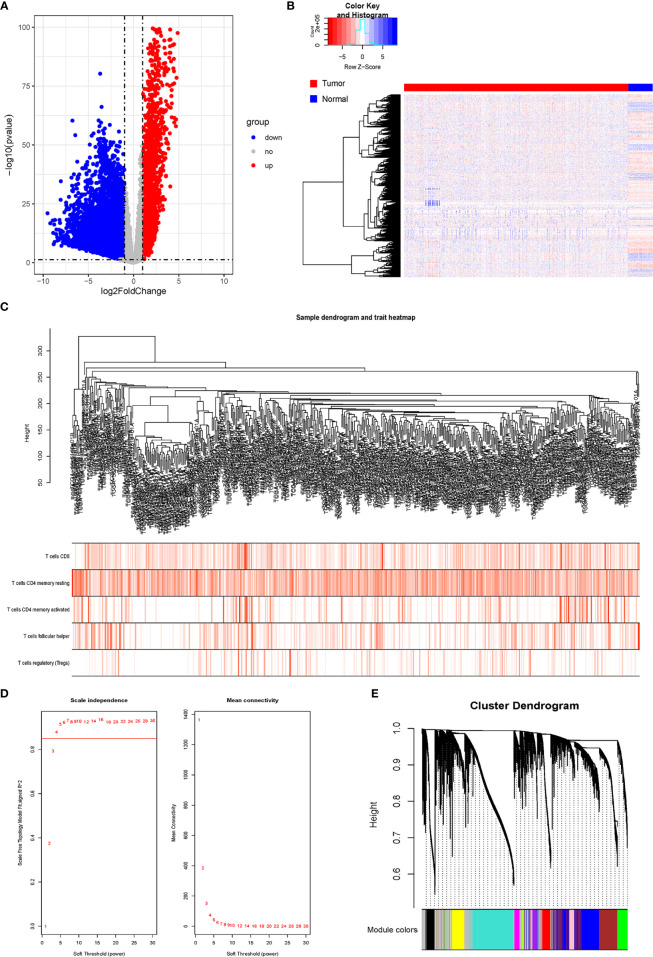
Figure 2.
Analysis of DRGs and WGCNA. (A) Volcano plot of differential genes. (B) Heatmap of DEGs. (C) Sample clustering of WGCNA. (D) Screening with soft threshold. (E) Clustering of DEGs. DRG, differentially regulated gene; WGCNA, weighted gene co-expression network analysis; DEG, differentially expressed gene.

