Figure 5.
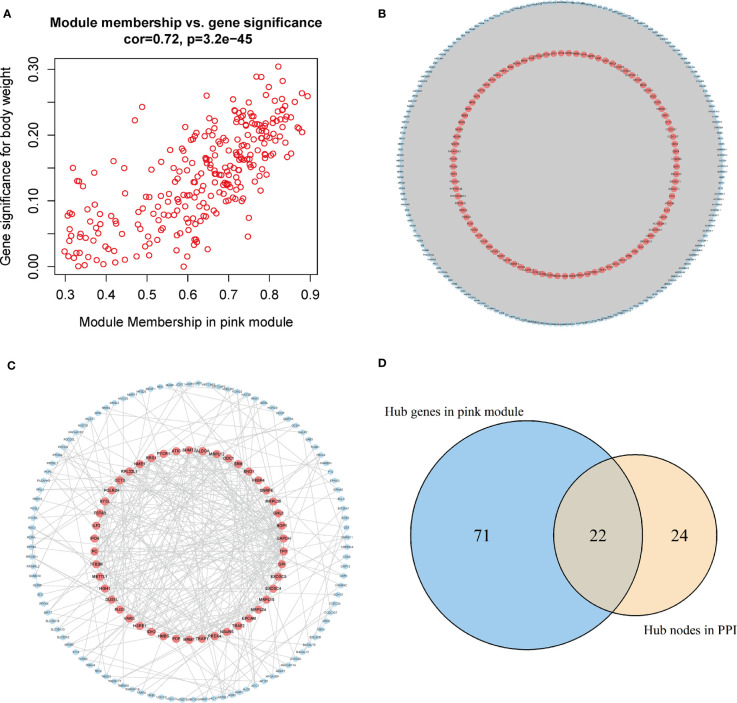
Acquisition of hub genes related to immune cell infiltration. (A) Correlation scatter diagram between pink genes and phenotypes of immune cell infiltration. (B) Pink gene co-expression network (red: the screened hub genes). (C) PPI network (red: the screened hub proteins). (D) Venn map from the two types of screening. PPI, protein–protein interaction.

