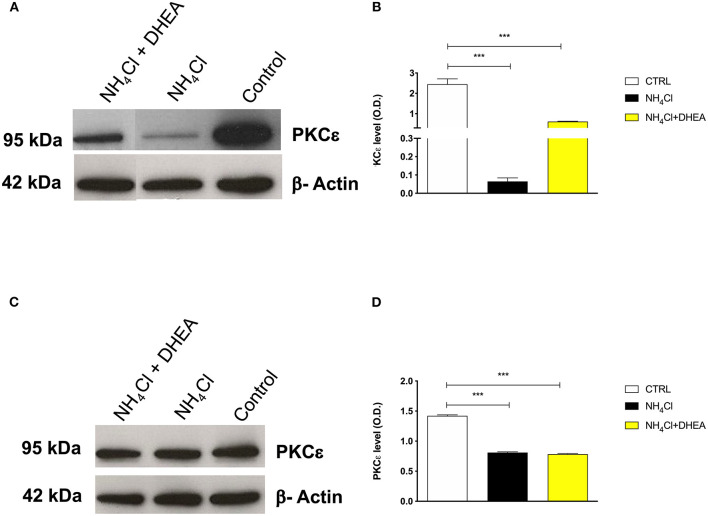
Figure 4.
Western blot analysis of cortex (A) and cerebellum (C) PKCε expression after 48 h of treatment with saline (control), NH4Cl, and NH4Cl + DHEA (β-actin was used as internal standard) and their respective representative blots (B,D); ***p < 0.001. Western blot pictures were spliced since cortex and cerebellum samples were loaded in wells far from the control.

