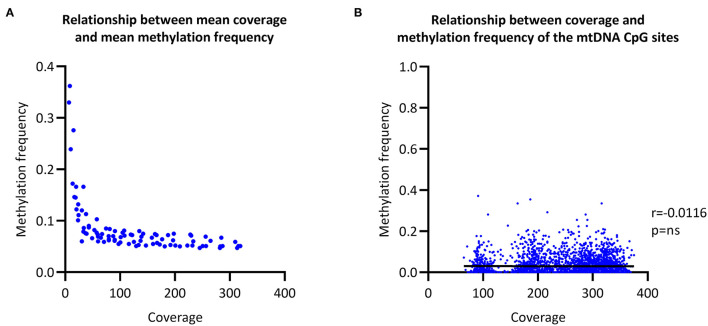
Figure 2.
Relationship between coverage and methylation frequency. (A) Overall relationship between the mean coverage and mean methylation frequency of different subsections of the obtained sequencing data. (B) Overall relationship between the coverage of each individual CpG site and the corresponding methylation frequency. r, Spearman's rank correlation coefficient; p, Spearman's exploratory p-value.

