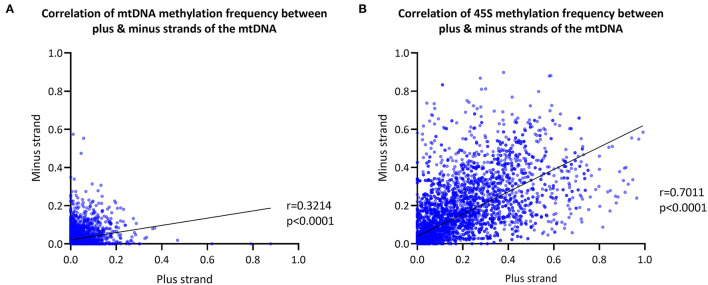
Figure 3.
Mitochondrial and 45S rRNA CpG methylation comparison by strand. (A) Correlation between the methylation frequency of the mitochondrial plus- and minus-strand (plus-strand = light-strand, minus-strand = heavy-strand). Data of the six blood-derived samples combined. (B) Correlation between the methylation frequency detected from the 45S rRNA gene plus- and minus-strand. Data of the six blood-derived samples combined. r, Spearman's rank correlation coefficient; p, Spearman's exploratory p-value.

