Figure 4.
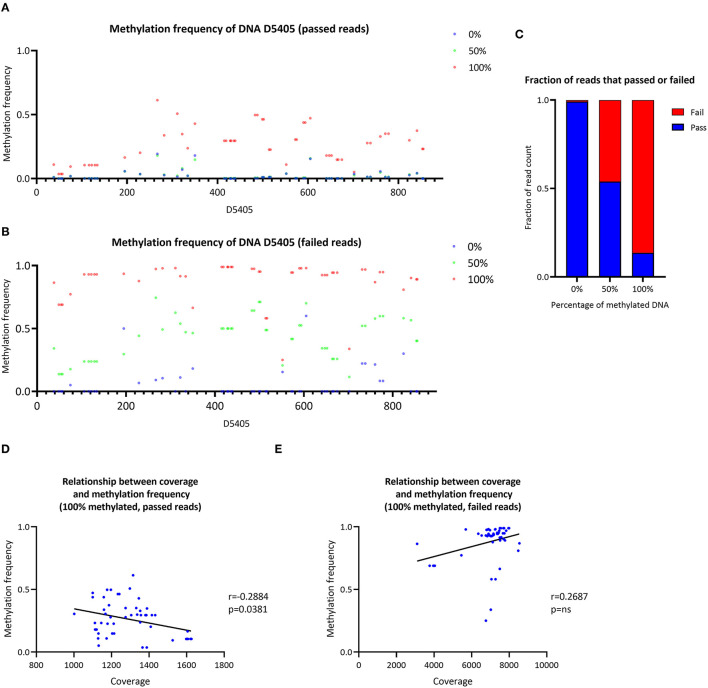
Analysis of synthetic DNA for the validation of the data analysis pipeline. (A) Methylation frequency detected by Nanopolish from three samples of synthetic DNA with different proportions of methylated DNA (0, 50 and 100%), only reads that passed Guppy quality threshold were included in the analysis. (B) Methylation frequency detected by Nanopolish from three samples of synthetic DNA with different proportions of methylated DNA (0, 50 and 100%), only reads that failed Guppy quality threshold were included in the analysis. (C) Stacked bar plot of the fraction of reads that passed (blue) or failed (red) the Guppy quality threshold, stratified by the ratio of methylated reads in the sample. (D) Relationship between the coverage and methylation frequency in the sample with 100% methylated reads, only reads that passed Guppy quality threshold were included in the analysis. (E) Relationship between the coverage and methylation frequency in the sample with 100% methylated reads, only reads that failed Guppy quality threshold were included in the analysis. r, Spearman's rank correlation coefficient; p, Spearman's exploratory p-value.

