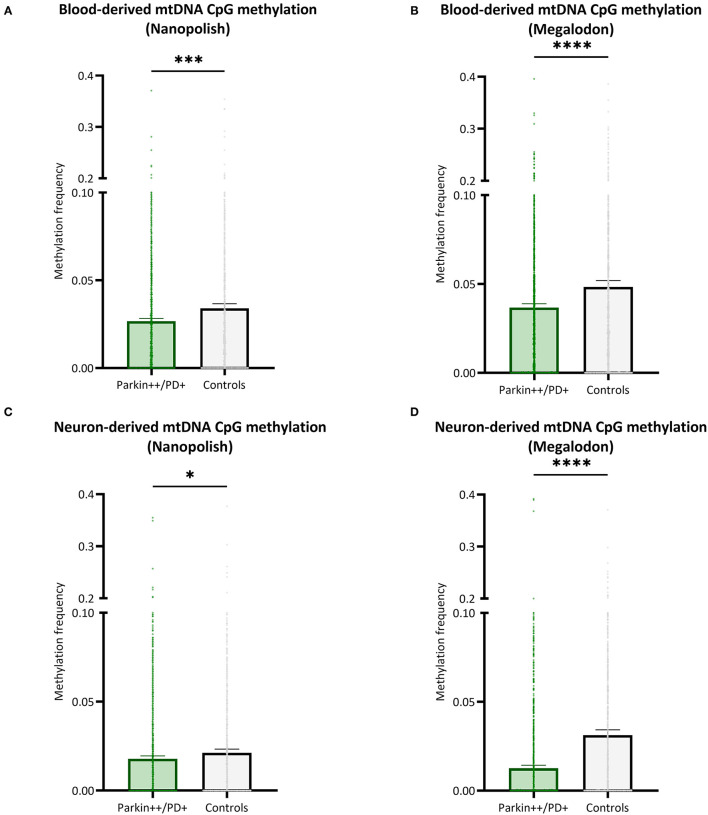
Figure 6.
Comparison of mtDNA CpG methylation between patients with Parkin-PD and healthy controls. (A,B) The bar plot shows the mtDNA CpG methylation from blood-derived DNA in patients with Parkin-PD and healthy control subjects, which was either detected with Nanopolish (A) or Megalodon (B). (C,D) The bar plot shows the mtDNA CpG methylation from neuron-derived DNA (iPSC-derived midbrain neurons) in patients with Parkin-PD and healthy control subjects, which was either detected with Nanopolish (A) or Megalodon (B). Bars indicate means and 95% confidence interval. The asterisks represent the level of significance (*p ≤ 0.05, **p ≤ 0.01, ***p ≤ 0.001, ****p ≤ 0.0001), p-value = Mann Whitney U-test performed for pairwise comparisons, Parkin++ = Parkin biallelic; PD+ = PD patient, patients are indicated in green and control subjects in gray.

