FIGURE 3.
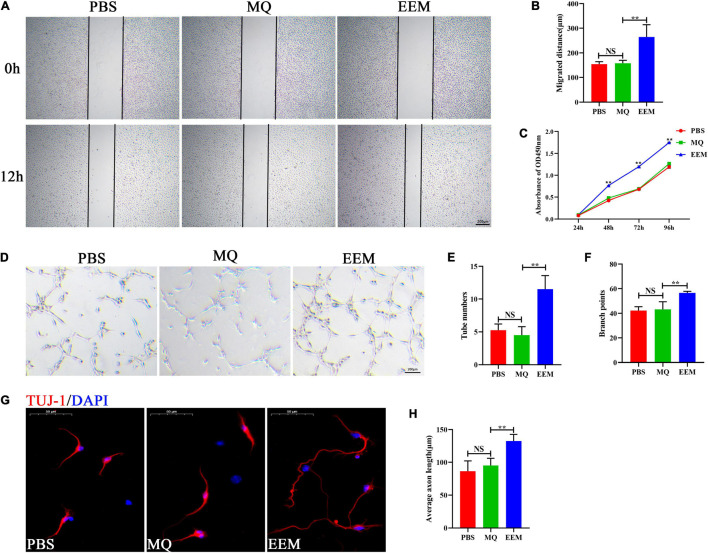
EEM promote angiogenic activity and axon growth in vitro. (A) Representative images of the horizontal migration of HUVECs in the EEM, MQ, and PBS treatment groups, as shown by wound healing experiments. (B) Quantification of the migration distance shown in (A) [F(2, 9) = 17.75, p < 0.05. Tukey’s post hoc test. PBS vs. MQ, p = 0.98; MQ vs. EEM, p < 0.01; n = 4 biological replicates for each group]. (C) Analysis of HUVECs proliferation by CCK-8 [F(2, 6) = 1,346, p < 0.01. Tukey’s post hoc test. MQ vs. EEM (24 h), p = 0.5071; MQ vs. EEM (48 h), p < 0.01; MQ vs. EEM (72 h), p < 0.01; MQ vs. EEM (96 h), p < 0.01; n = 3 biological replicates for each group]. (D) Representative images of HUVEC canaliculization in the EEM, MQ, and PBS treatment groups. Scale bar: 200 μm. (E) Quantification of tube numbers of (D) [F(2, 9) = 25.63, p < 0.01. Tukey’s post hoc test. PBS vs. MQ, p = 0.77; MQ vs. EEM, p < 0.01; n = 4 biological replicates for each group]. (F) Quantification of branch points of (D) [F(2, 9) = 15.98, p < 0.01. Tukey’s post hoc test. PBS vs. MQ, p = 0.93; MQ vs. EEM, p < 0.01; n = 4 biological replicates for each group]. (G) Representative immunofluorescence images of TUJ1 (red) in the EEM, MQ, and PBS treatment groups. Scale bar: 50 μm. (H) Quantification of the average axon length in (G) [F(2, 12) = 19.03, p < 0.01. Tukey’s post hoc test. PBS vs. MQ, p = 0.53; MQ vs. EEM, p < 0.01; n = 5 biological replicates for each group]. The data are presented as the means ± SD. *p < 0.05, **p < 0.01, NS = Not significant.

