Figure 7.

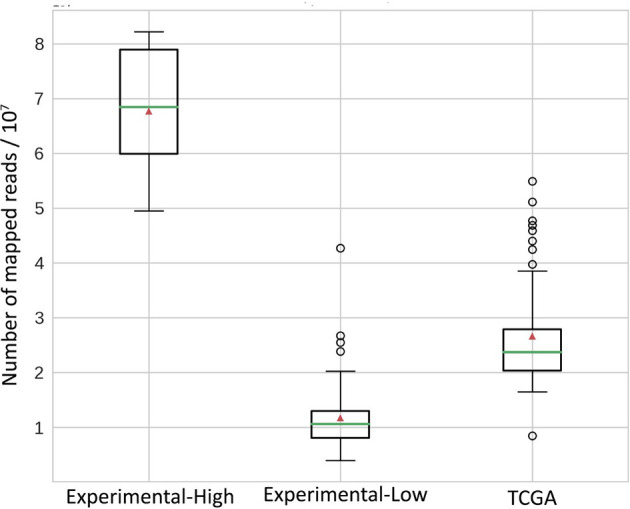
Distribution of mapped reads in RNAseq BAM files. All reads were approximately 50 bases long. Green horizontal lines indicate the median, red triangles indicate the mean.

Distribution of mapped reads in RNAseq BAM files. All reads were approximately 50 bases long. Green horizontal lines indicate the median, red triangles indicate the mean.