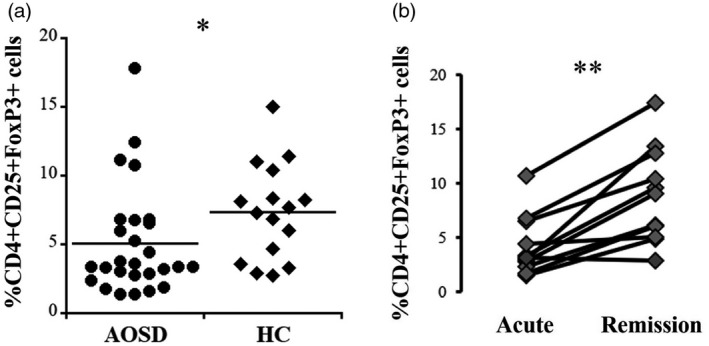
FIGURE 1.

Proportions of circulating CD4+CD25+forkhead box protein 3 (FoxP3+) cells [regulatory T cells (Tregs)]. (a) Comparison of Tregs between patients with acute adult‐onset Still’s disease (AOSD) and healthy controls (HC). (b) Differences in the proportions of Tregs in 11 patients between the acute and remission phases of AOSD. The Mann–Whitney U‐test was used for comparison between the acute AOSD patients and HC. Wilcoxon’s signed‐rank test was used for comparison between acute and remission phases in 11 AOSD patients. *p < 0.05, **p < 0.005
