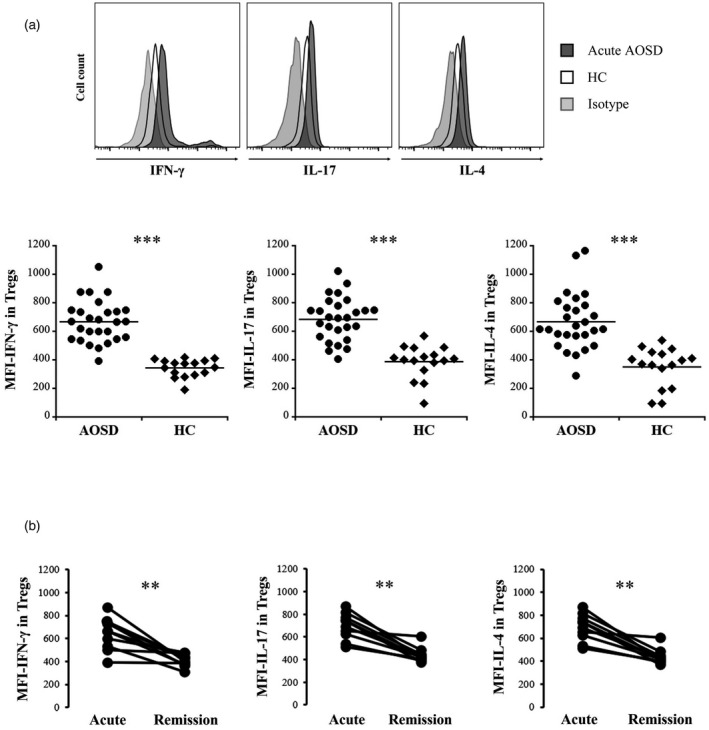
FIGURE 2.

Intracellular expression levels of effector cytokines in CD4+CD25+forkhead box protein 3 (FoxP3+) cells [regulatory T cells (Tregs)]. (a): (Upper panels) Representative histograms of interferon (IFN)‐γ, interleukin (IL)‐17 and IL‐4 expression in Tregs (lower bar graphs). Comparisons of the median fluorescence index (MFI) of IFN‐γ, IL‐17 and IL‐4 in Tregs between patients with acute adult‐onset Still’s disease (AOSD) and HC. (b) Differences in the MFI of IFN‐γ, IL‐17 and IL‐4 in Tregs from 11 patients between acute and remission phases. The Mann–Whitney U‐test was used for comparisons between the acute AOSD patients and the HC. The Wilcoxon signed‐rank test was used for comparisons between acute and remission phases in 11 AOSD patients. **p < 0.005, ***p < 0.0001
