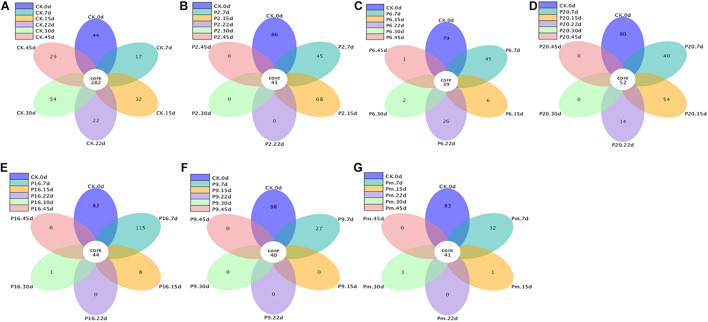
FIGURE 5.
Flower figure showing the unique and shared OTUs of the bacterial communities across different stages. Only with more than five groups can the flower figure be shown. The plotting was carried out after homogenization of all samples. CK, Control; P2, Staphylococcus xylosus; P6, Leuconostoc mesenteroides; P9, Carnobacterium maltaromaticum; P16, Leuconostoc gelidum; P20, Serratia liquefaciens; Pm, The five strains in combination.

