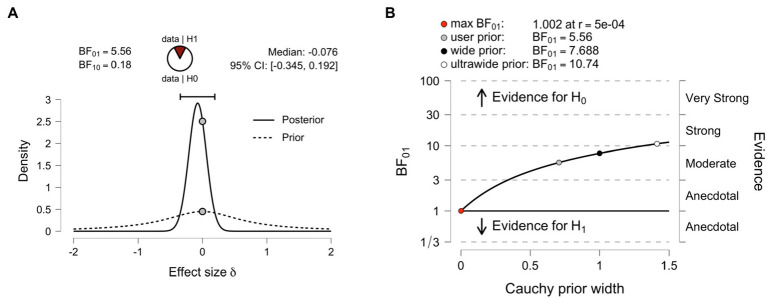
Figure 6.
Meta-analysis of Experiments 1–4. The panels show inferential plots of a Bayesian independent-samples t-test, for normalized data (using z-scores) combined from Experiments 1–4 with control condition vs. (cool temperature) experimental condition. The left panel (A) shows the posterior and prior; the right panel (B) shows the Bayes factor robustness check.

