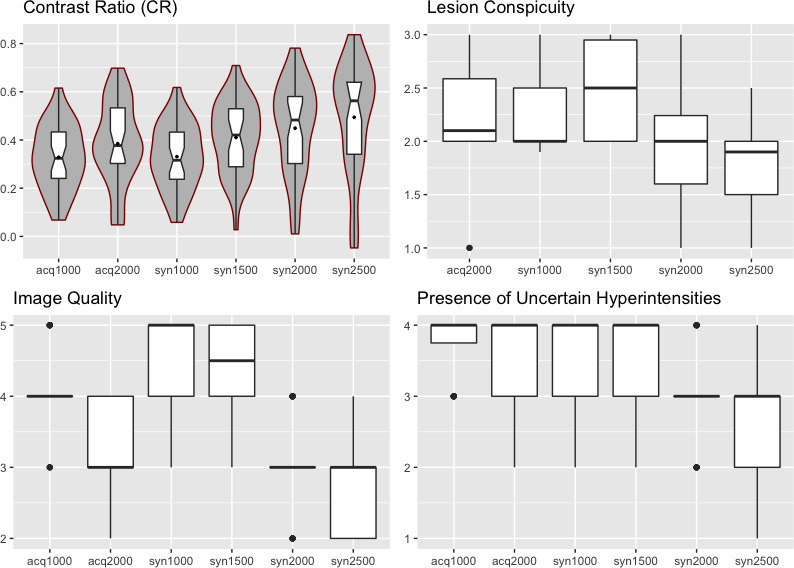
Figure 3.

Boxplots depicting data from quantitative and qualitative image analysis from reader 1. The line in the box shows the median, the lower and upper hinges correspond to the first and third quartiles. The upper/lower whisker extends from the hinge to the largest/smallest value no further than 1.5 * IQR from the hinge. For contrast ratio (CR), violin plots showing the probability density of the data at specific values smoothed by a kernel density estimator surround the boxplots.
