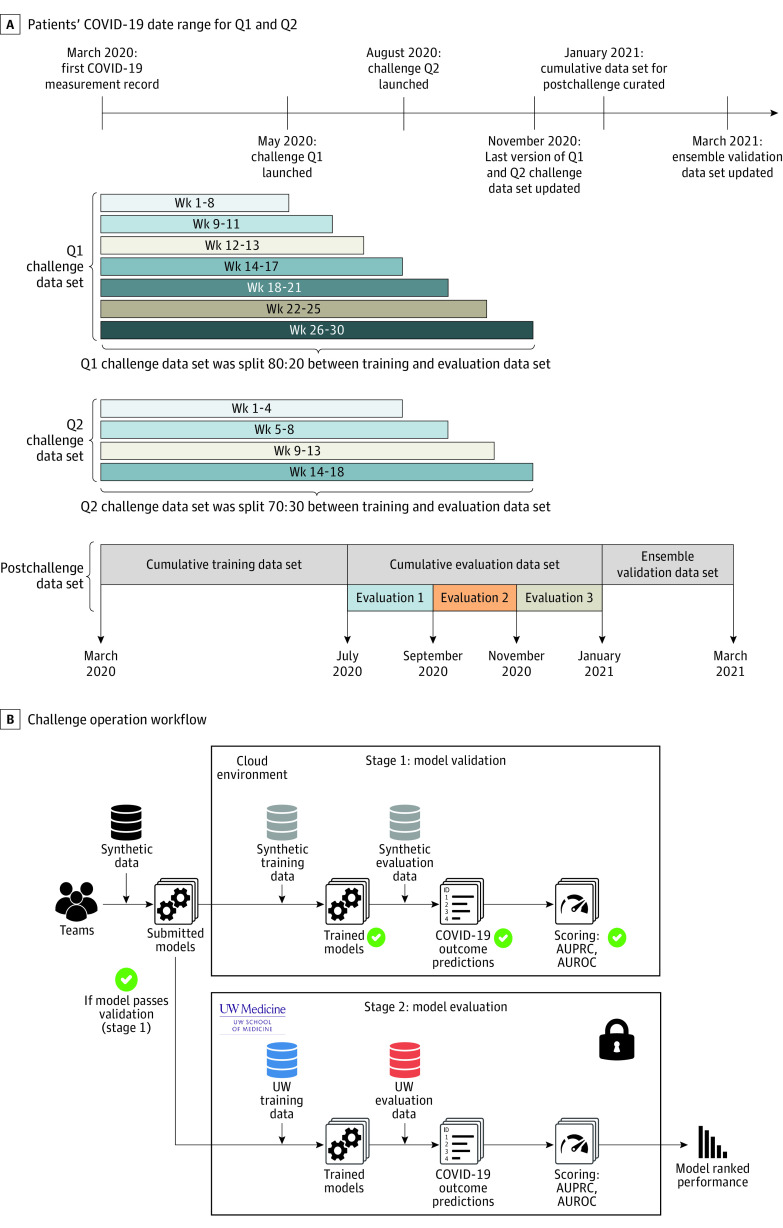
Figure 1. Visualization of the Challenge Timeline and Data.
A, Patients’ COVID-19 measurement date range in the data sets for question 1 (Q1) and question 2 (Q2). The plot includes both challenge data sets (used in the challenge) and cumulative data sets (used in postchallenge analysis). B, Challenge operation workflow. When a participant submitted a model to the challenge platform, Synapse, the model underwent a validation procedure on a cloud environment, in which the model was run against the synthetic data set (stage 1: model validation). If the model passed all the tests, the model was then pulled into a University of Washington (UW) secure environment, where it was trained and then applied to patient data (the holdout set from the full patient data set) to generate predictions (stage 2 model: evaluation). AUPRC indicates area under the precision recall curve; and AUROC, area under the receiver operating characteristic curve.

