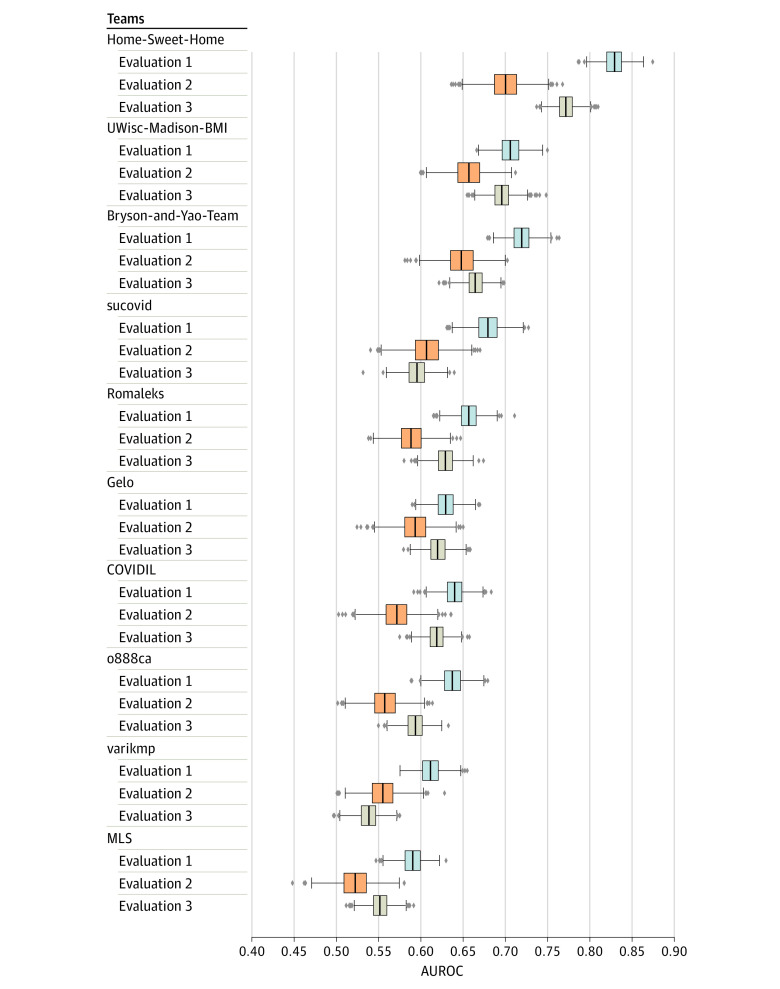
Figure 3. Performance of Question 1 Models on Prospective Data sets.
Models were trained on the cumulative training data set and evaluated on the temporally split cumulative evaluation data set (evaluation 1, evaluation 2, and evaluation 3) based on the date when patients were tested for COVID-19. The model performance on evaluation 1 was significantly better than the other 2 data sets (P < .001). Model performance on evaluation 3 was better than evaluation 2. This might be because evaluation 3 data set’s positive ratio (5.7%) was more similar to the training data set (5.2%) than evaluation 2 (2.5%). From left to right, the box indicates the 25th to 75th percentile; the error bars indicate the minimum and maximum, respectively, excluding the outliers; the diamonds indicate outliers; and the vertical line in each box is the median value. AUROC indicates area under the receiver operating characteristic curve.

