
Figure 4. Performance of Question 1 Models in Postchallenge Analysis.
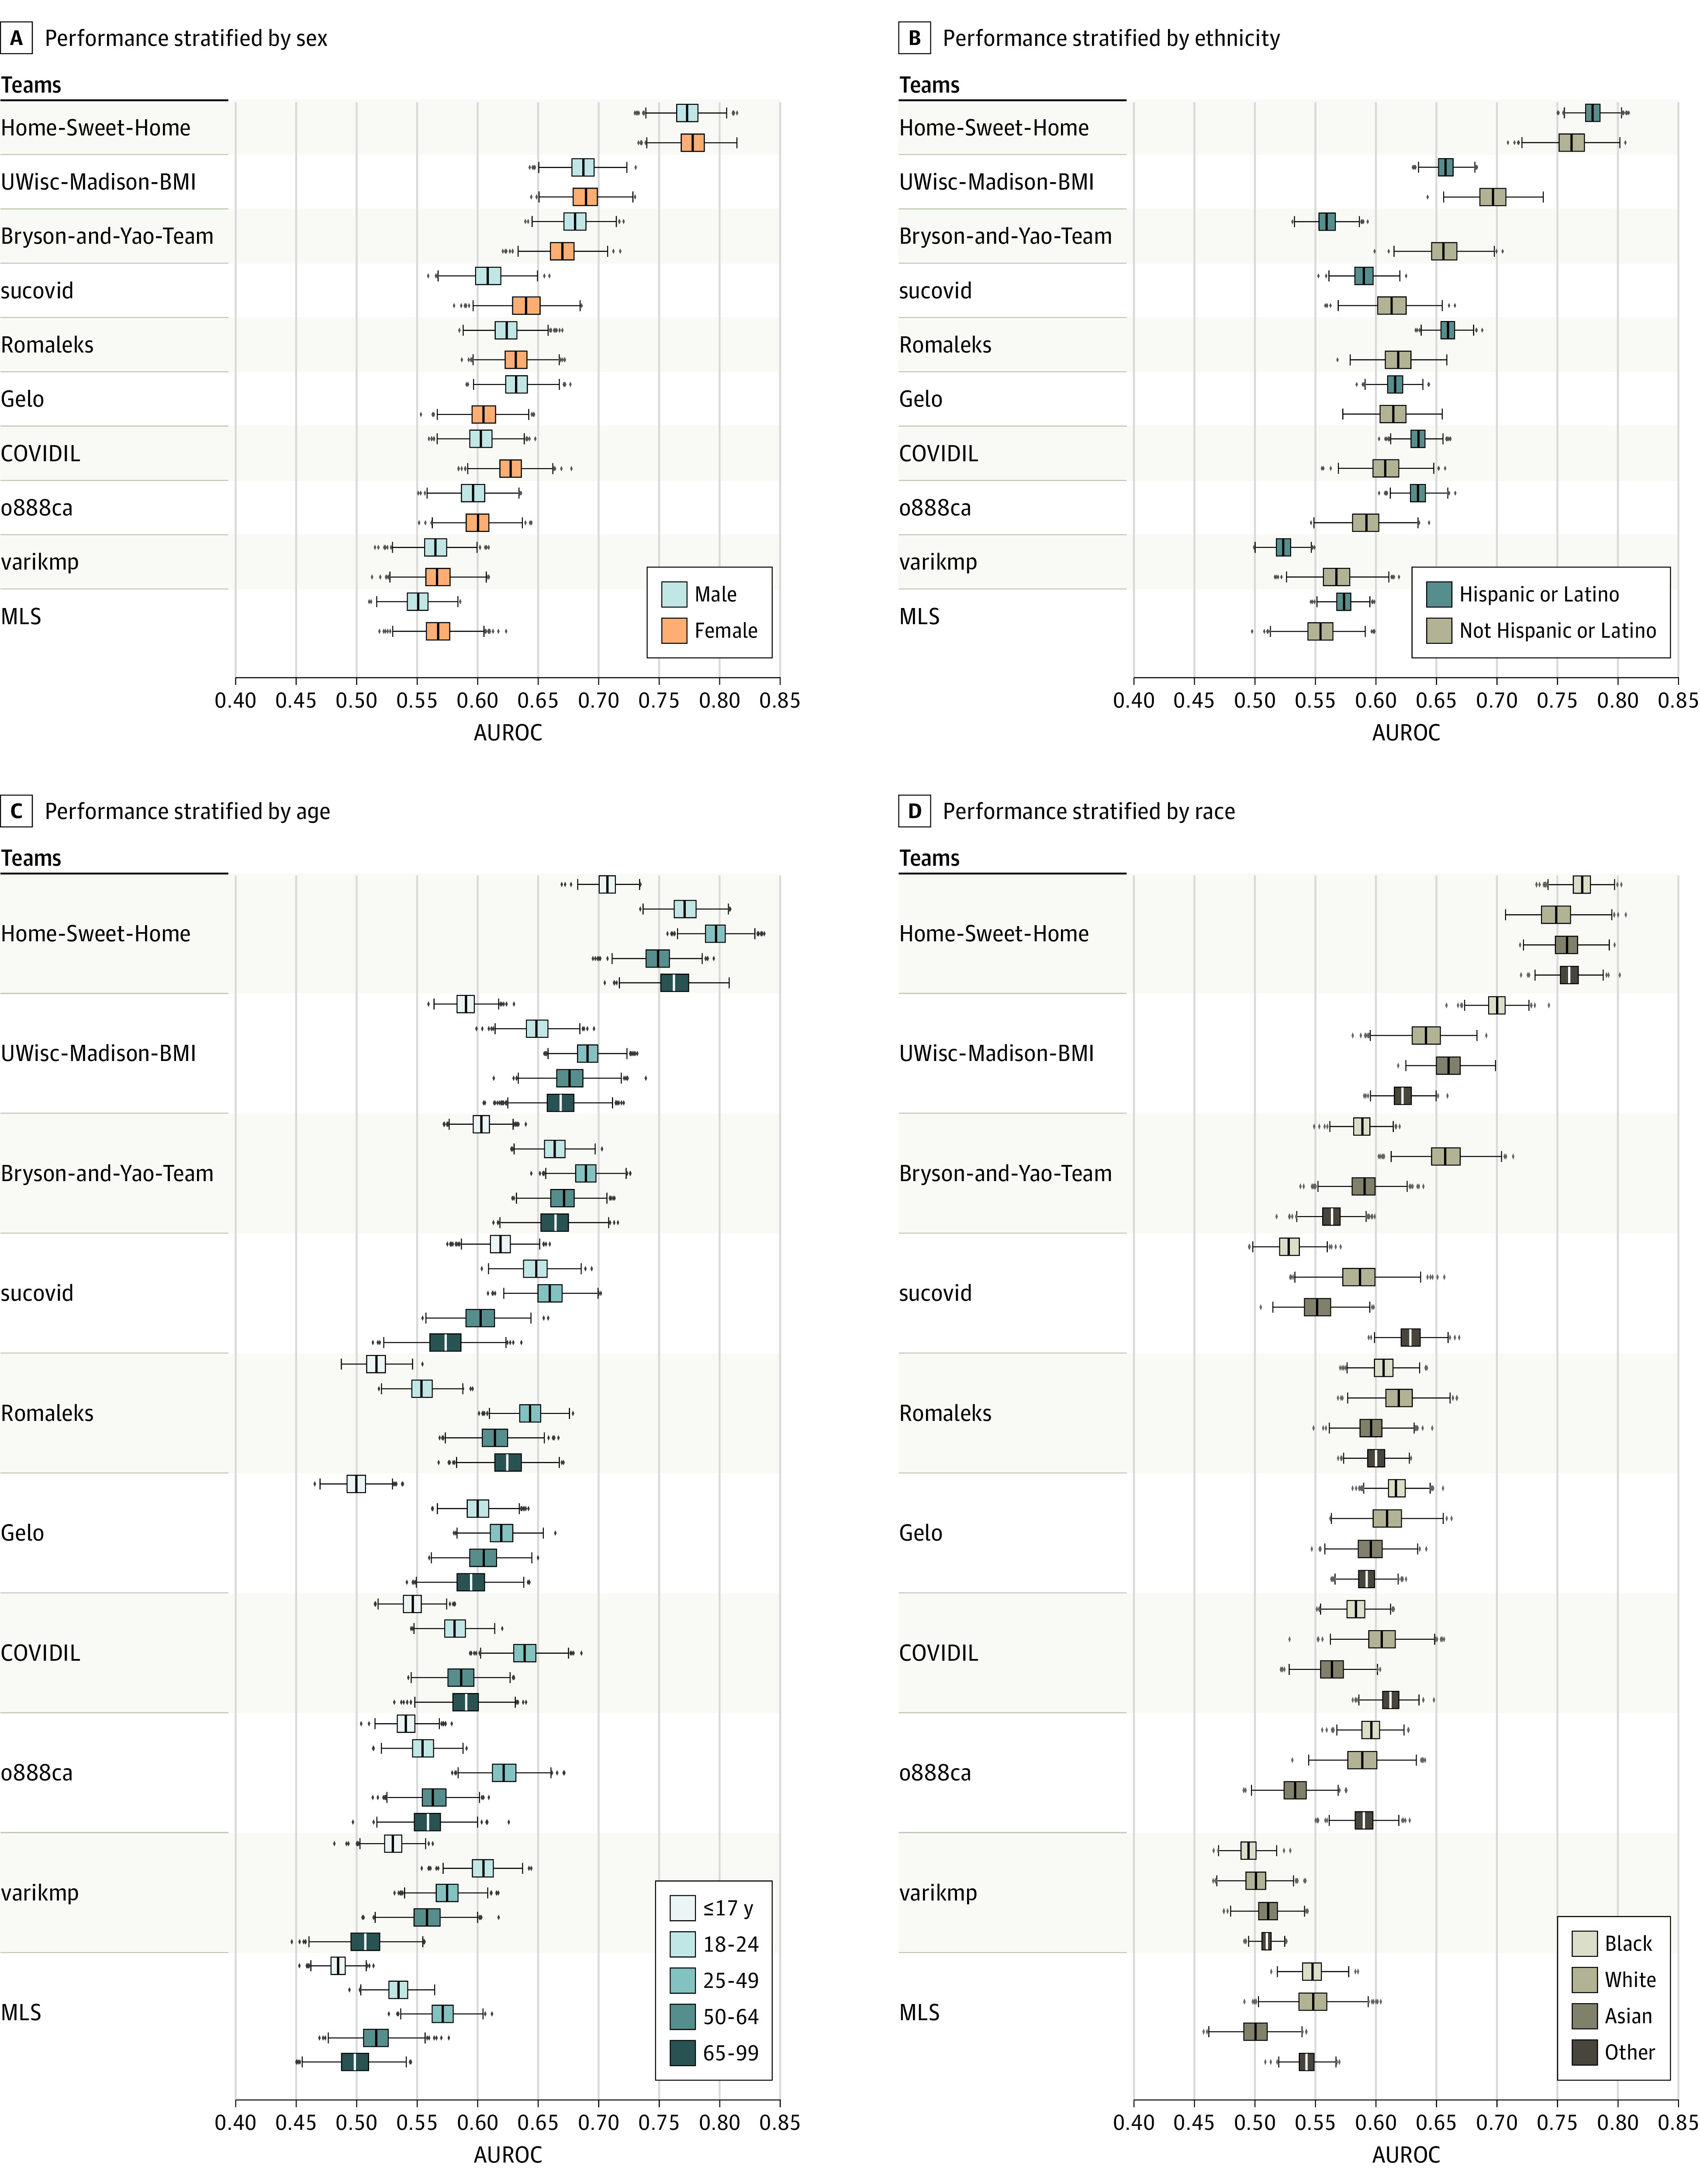
A, Performance of top 10 question 1 models on subpopulations stratified by sex. B, Performance of top 10 question 1 models on subpopulations stratified by ethnicity. C, Performance of top 10 question 1 models on subpopulations stratified by age. D, Performance of top 10 question 1 models on subpopulations stratified by race. From left to right, the box indicates the 25th to 75th percentile; the error bars indicate the minimum and maximum, respectively, excluding the outliers; the diamonds indicate outliers; and the vertical line in each box is the median value. AUROC indicates area under the receiver operating characteristic curve.