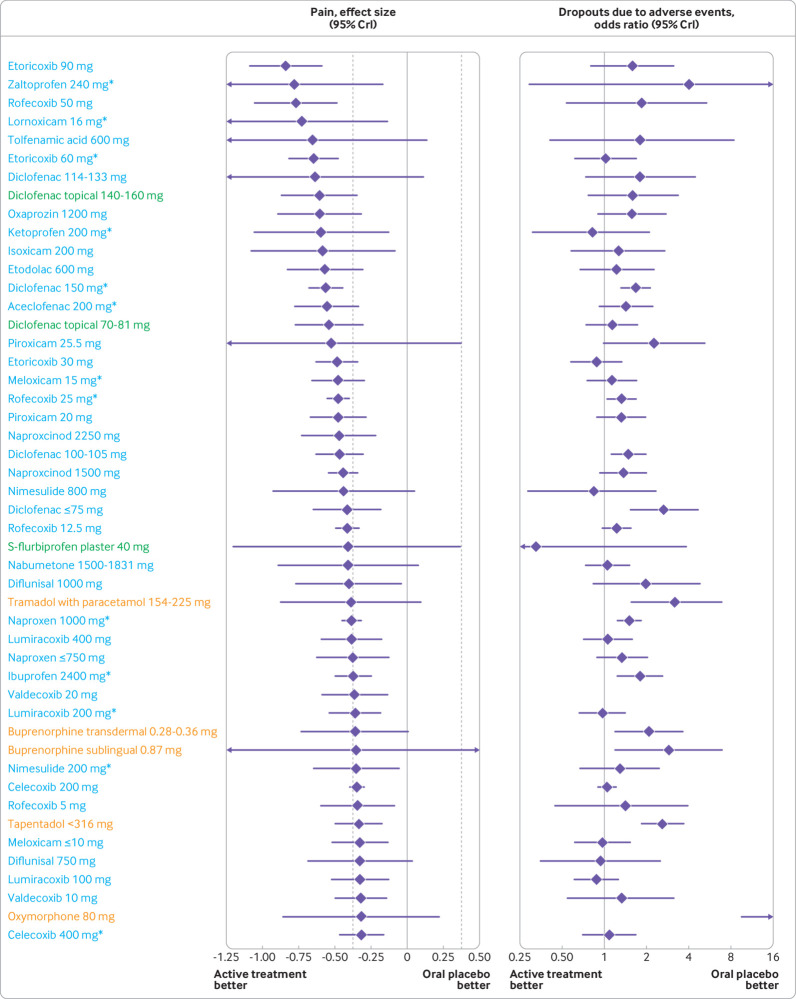
Fig 2.
Treatment effect on osteoarthritis pain and dropouts due to adverse events compared with oral placebo, ordered according to treatment effect size on osteoarthritis pain. Blue: oral non-steroidal anti-inflammatory drugs; green: topical non-steroidal anti-inflammatory drugs; orange: opioids. Area between dashed lines shows treatment effect estimates below the minimum clinically important difference. See web-appendix 17 for caterpillar plot ordered according to odds ratio of dropouts due to adverse events. See table 2, table 3, and web-appendix 7 for specific estimates with 95% CrI and additional outcome. *Maximum daily recommended dose. CrI=credible interval

