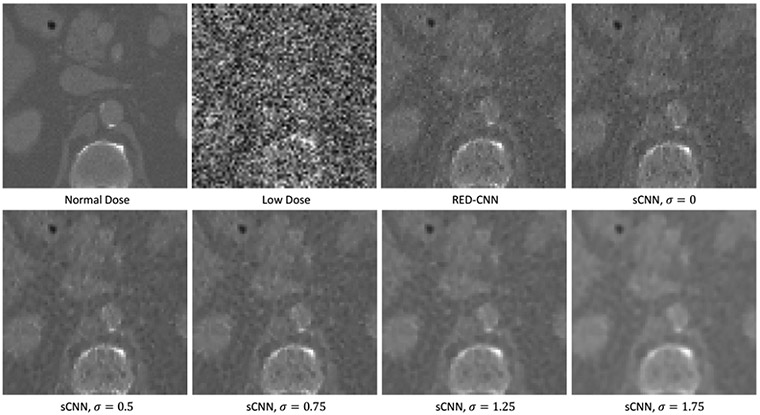
Figure 3:

One example in the testing set. The normal dose image (ground truth), the simulated low-dose image, and the denoised images with the RED-CNN model or the proposed sCNN model at different resolution levels are displayed. All display windows are [0,0.03] mm−1
