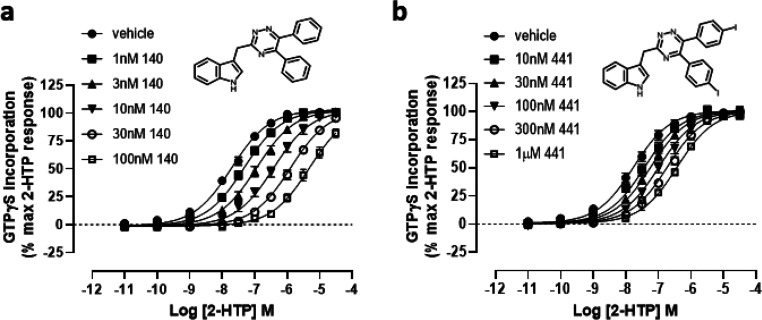
Figure 7.
Characterization of compounds 140 and 441. Ability of varying concentrations of compound 140 (a) and compound 441 (b) (structures shown as inserts) to alter the concentration–response curve of 2-HTP in [35S]GTPγS binding assays performed using membranes of Flp-In TREx 293 cells induced to stably express a human GPR84-Gαi2 fusion protein. See Table 1 for details.

