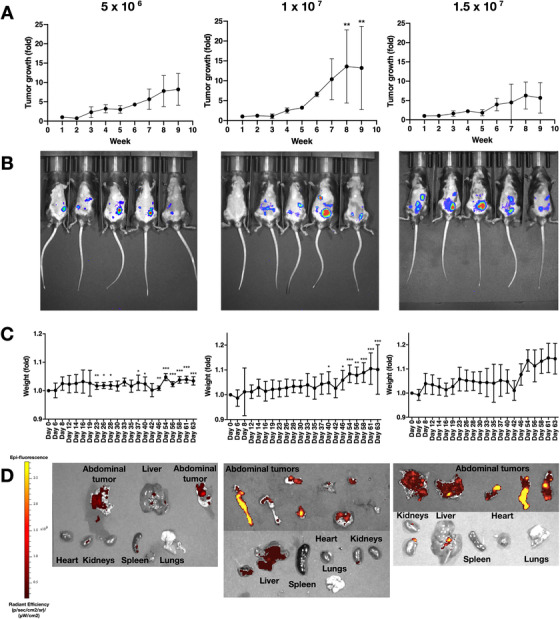
FIGURE 1.

Tumor model generation and optimization. (A) Tumor growth signal quantification over a 9‐week period by IVIS following injection of 5 × 10⁶, 1 × 10⁷, or 1.5 × 10⁷ cells (n = 5). (B) Representative IVIS images of each tumor group taken after 6 weeks from tumor cells injection. (C) Mice weights (grams), expressed as fold change, during the 9‐week experimental period (n = 5). (D) IVIS images of organs extracted from the mice abdomen 9 weeks after injection with 5 × 10⁶, 1 × 10 7, or 1.5 × 10⁷ ID8‐Luc/GFP cells. Extracted organs include liver, spleen, kidneys, lungs, heart, peritoneal membranes, tumor nodules. Epi‐fluorescent signals reflects the presence of ID8‐Luc/GFP cells. Data are expressed as mean (SD) from 5 independent experiments. Data were analyzed by ANOVA and Dunnett's pairwise multiple comparison test; values differ from week 1 (A) or day 0 (C), *P < 0.05, **P < 0.01, ***P < 0.001
