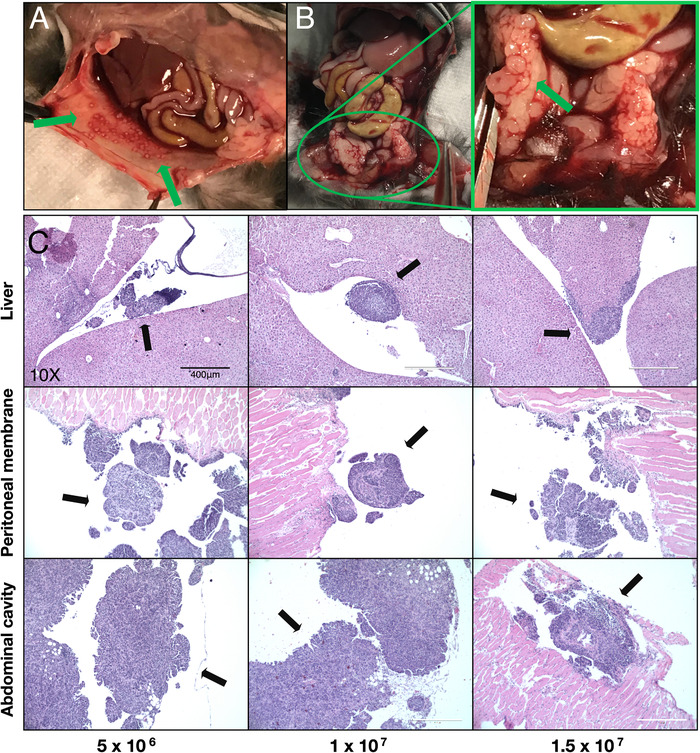
FIGURE 2.

Histological assessment and localization of tumor nodules within the peritoneal cavity. (A) Representative images of tumor growth on the peritoneal membrane (green arrows). (B) Representative images of tumor growth within the lower abdominal cavity, indicated by the green arrow in the inset image. (C) H&E staining of tumor nodules found in the liver, peritoneal membrane, and abdominal cavity (black arrows). Magnification: 10×, scale bar: 400 μm
