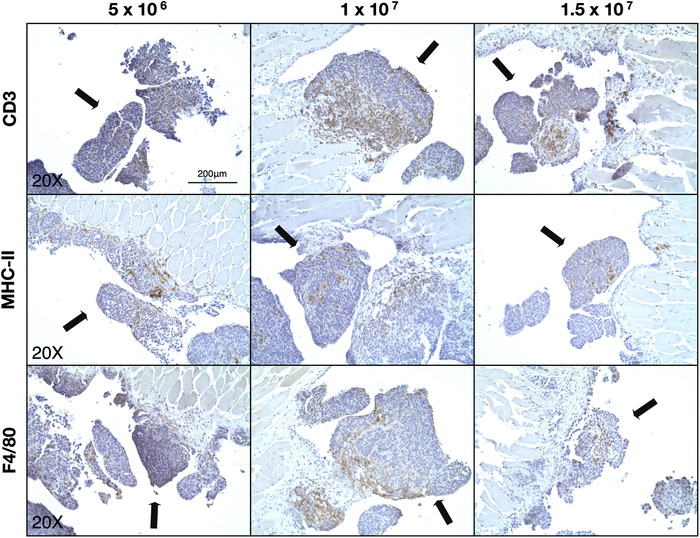
FIGURE 3.

Identification of immune cell infiltration within tumors of the peritoneal membrane. Representative IHC images of each of the experimental groups showing the presence of CD3+, MHC‐II+, and F4/80+ cells (T cells, APC, and macrophages, respectively) within tumors on the peritoneal membrane. Black arrows indicate the tumor masses. Magnification: 20×, scale bar: 200 μm
